

Question: Question 2 (20 marks) Table 2.1 gives the strain-life test data at nonzero mean stresses for pre- strained 2024-T4 aluminum. (a) Plot a versus
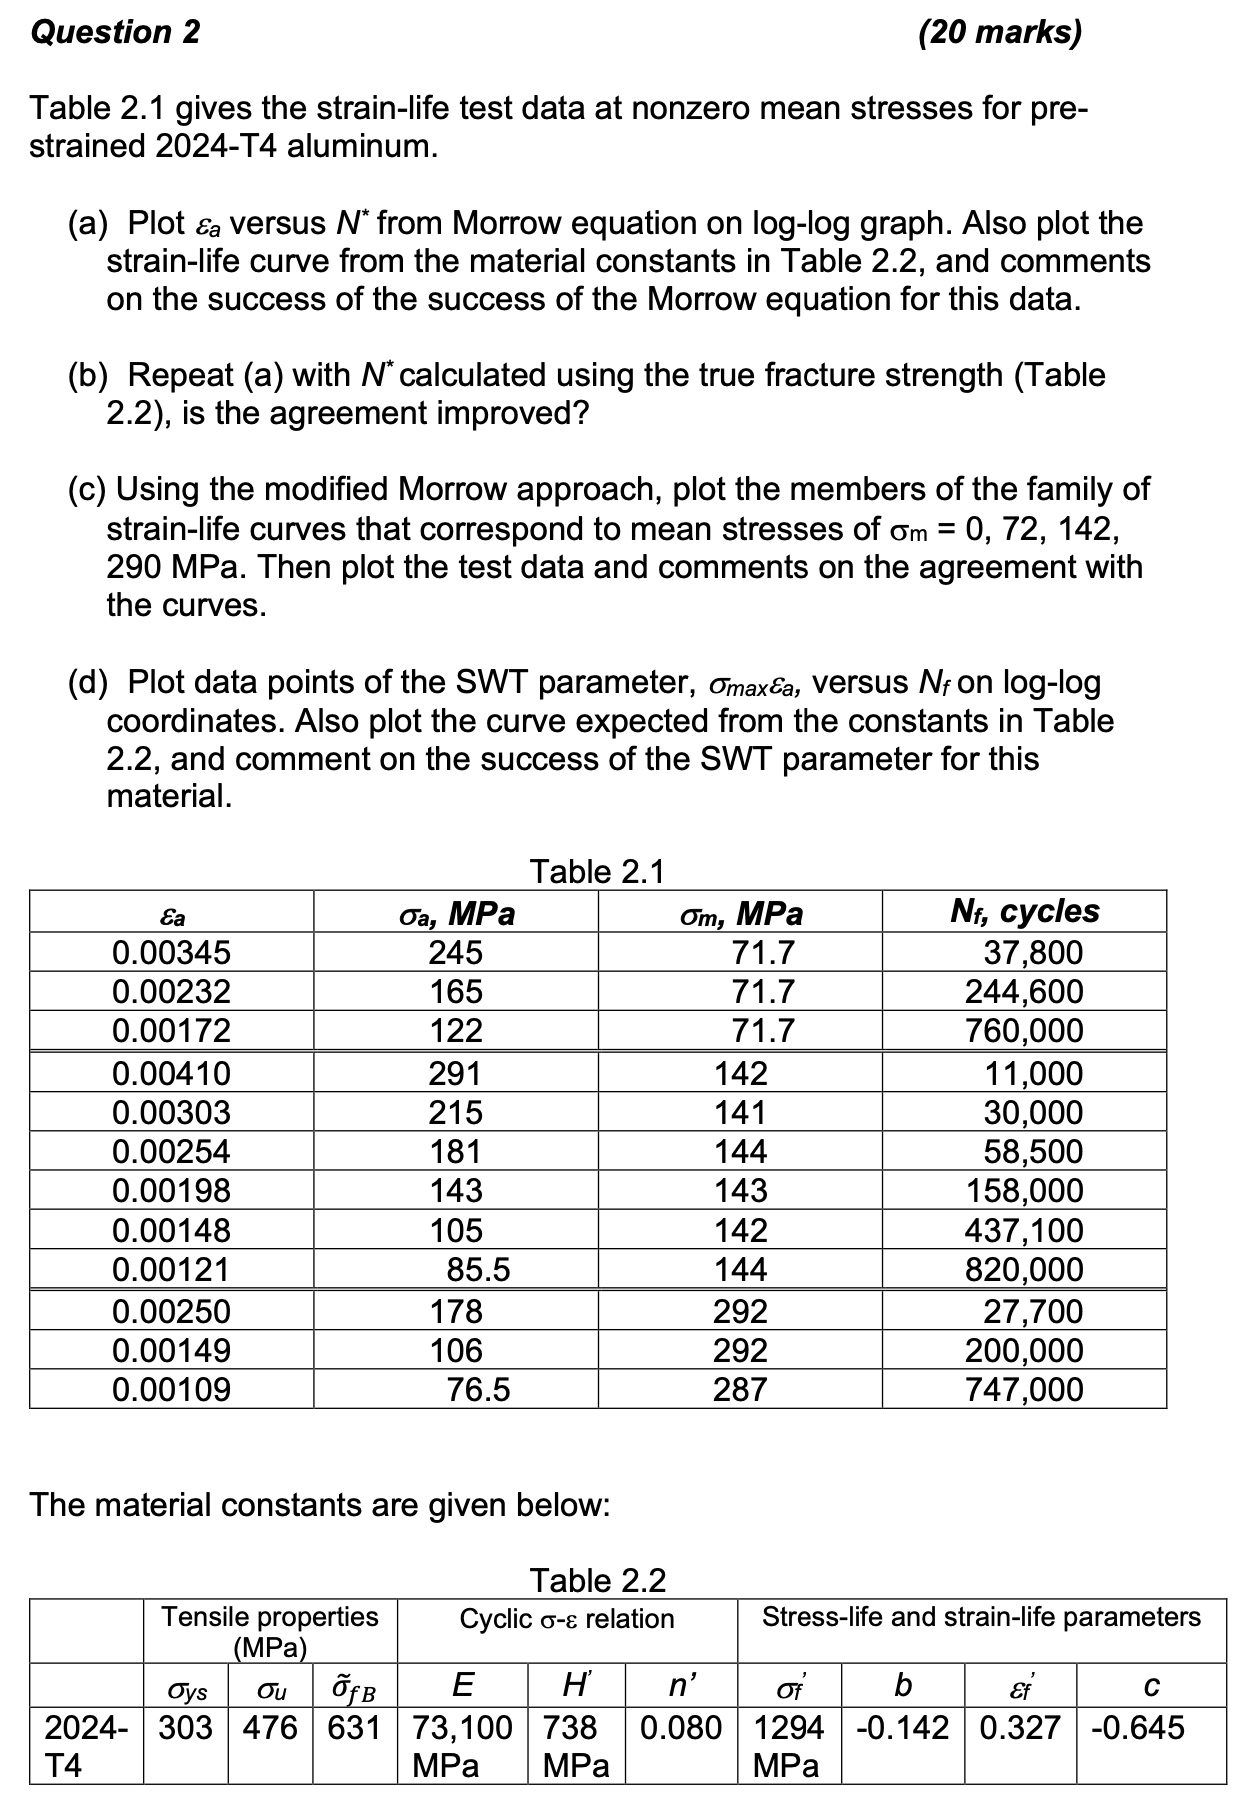
Question 2 (20 marks) Table 2.1 gives the strain-life test data at nonzero mean stresses for pre- strained 2024-T4 aluminum. (a) Plot a versus N* from Morrow equation on log-log graph. Also plot the strain-life curve from the material constants in Table 2.2, and comments on the success of the success of the Morrow equation for this data. (b) Repeat (a) with N* calculated using the true fracture strength (Table 2.2), is the agreement improved? (c) Using the modified Morrow approach, plot the members of the family of strain-life curves that correspond to mean stresses of m = 0, 72, 142, 290 MPa. Then plot the test data and comments on the agreement with the curves. (d) Plot data points of the SWT parameter, Omaxa, versus N on log-log coordinates. Also plot the curve expected from the constants in Table 2.2, and comment on the success of the SWT parameter for this material. Table 2.1 Ea Oa, MPa Om, MPa Nf, cycles 0.00345 245 71.7 37,800 0.00232 165 71.7 244,600 0.00172 122 71.7 760,000 0.00410 291 142 11,000 0.00303 215 141 30,000 0.00254 181 144 58,500 0.00198 143 143 158,000 0.00148 105 142 437,100 0.00121 85.5 144 820,000 0.00250 178 292 27,700 0.00149 106 292 200,000 0.00109 76.5 287 747,000 The material constants are given below: Tensile properties Table 2.2 Cyclic - relation Stress-life and strain-life parameters H Ef E n' 2024-303 476 631 73,100 738 0.080 T4 (MPa) Oys of B MPa MPa b 1294 -0.142 0.327 -0.645 MPa
Step by Step Solution
There are 3 Steps involved in it

Get step-by-step solutions from verified subject matter experts