

Question: QUESTION 2 (20 POINTS) The figure below shows the simulation results of 3 cases with different dispersion coefficients (50, 5 and 0.05). Other parameters remain
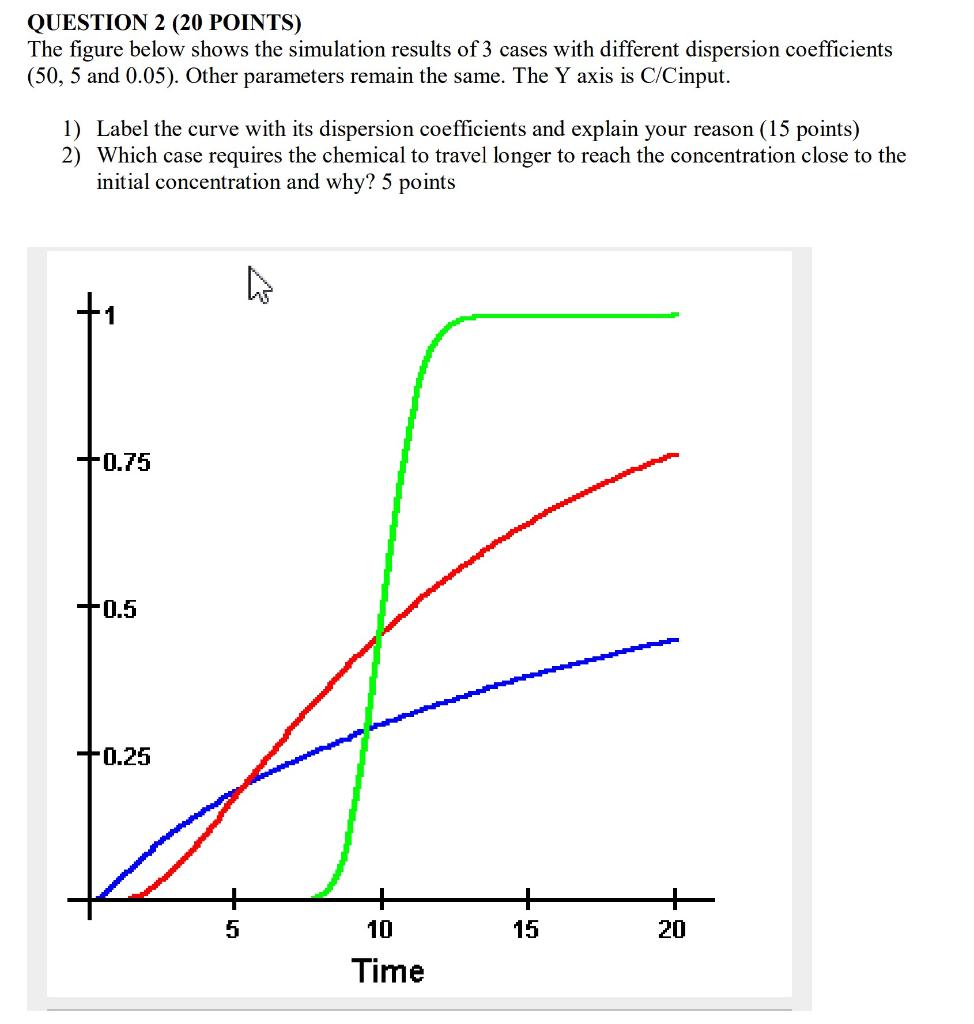
QUESTION 2 (20 POINTS) The figure below shows the simulation results of 3 cases with different dispersion coefficients (50, 5 and 0.05). Other parameters remain the same. The Y axis is C/Cinput. 1) Label the curve with its dispersion coefficients and explain your reason (15 points) 2) Which case requires the chemical to travel longer to reach the concentration close to the initial concentration and why? 5 points +1 +0.75 -0.5 -0.25 + + 10 Time + 20 15
Step by Step Solution
There are 3 Steps involved in it
1 Expert Approved Answer
Step: 1 Unlock

Question Has Been Solved by an Expert!
Get step-by-step solutions from verified subject matter experts
Step: 2 Unlock
Step: 3 Unlock