

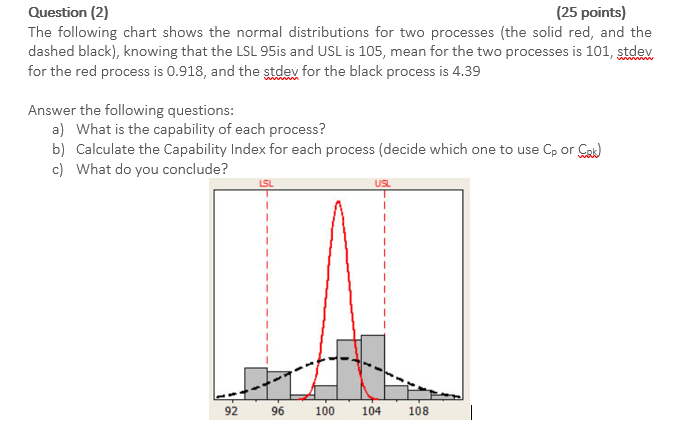
Question: Question (2) (25 points) The following chart shows the normal distributions for two processes (the solid red, and the dashed black), knowing that the LSL
Step by Step Solution
There are 3 Steps involved in it
1 Expert Approved Answer
Step: 1 Unlock

Question Has Been Solved by an Expert!
Get step-by-step solutions from verified subject matter experts
Step: 2 Unlock
Step: 3 Unlock