

Question: Question 2 5 ( 5 points ) Draw the control charts ( x - bar and R ) for the data given below. Show all
Question points
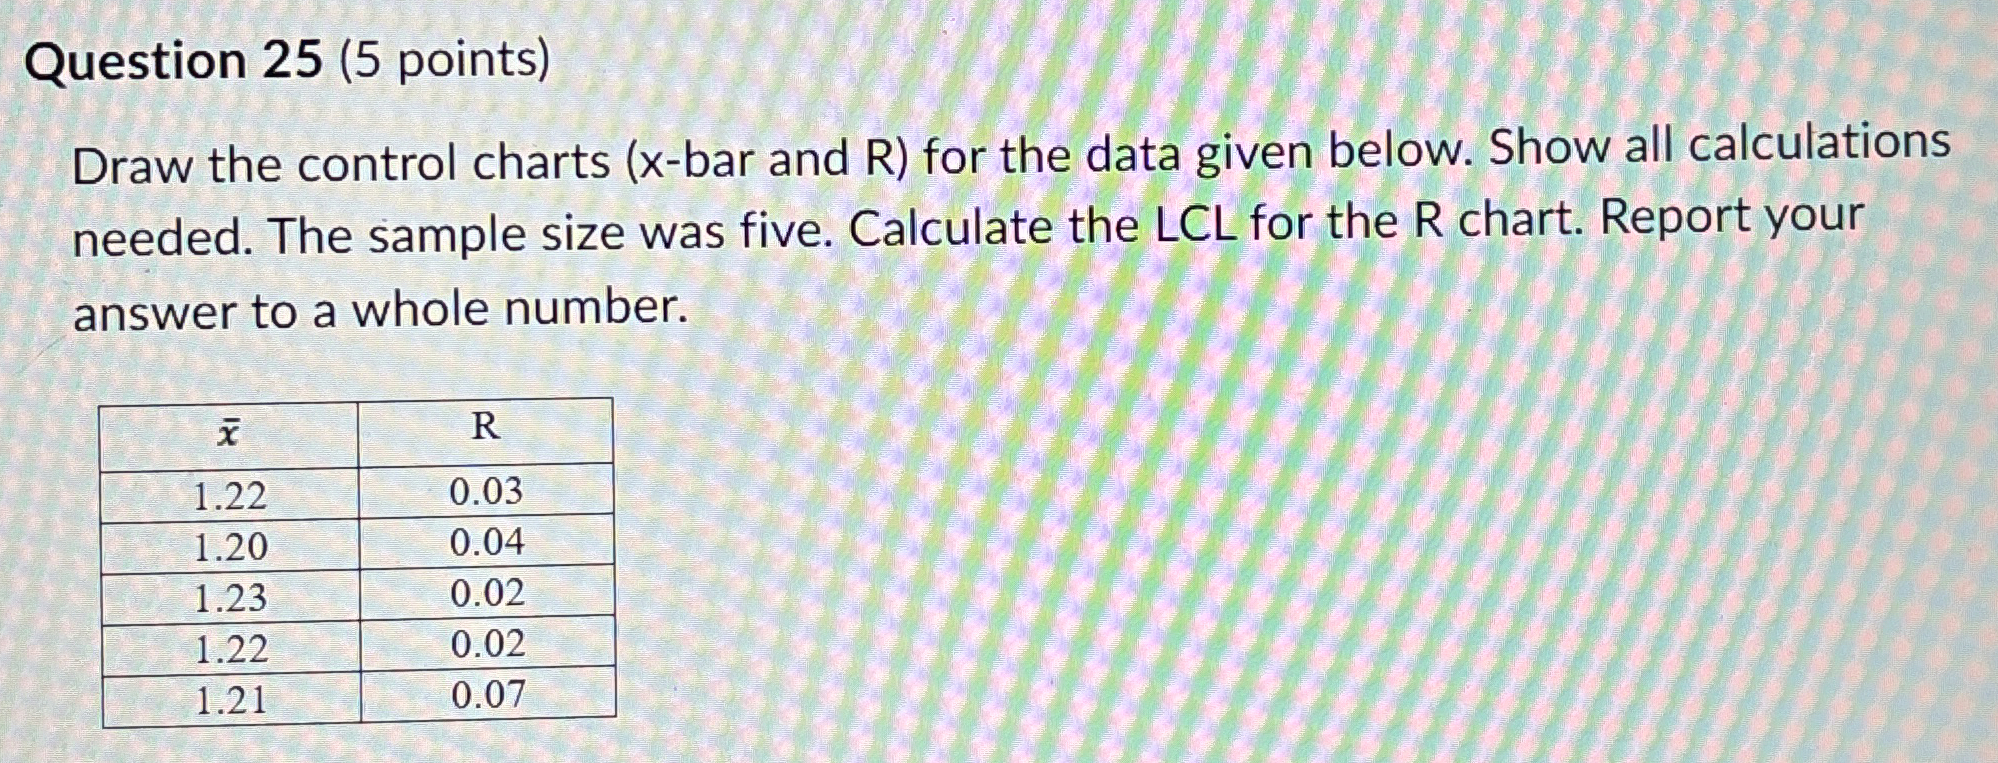
Draw the control charts bar and R for the data given below. Show all calculations
needed. The sample size was five. Calculate the LCL for the R chart. Report your
answer to a whole number.
Step by Step Solution
There are 3 Steps involved in it
1 Expert Approved Answer
Step: 1 Unlock

Question Has Been Solved by an Expert!
Get step-by-step solutions from verified subject matter experts
Step: 2 Unlock
Step: 3 Unlock