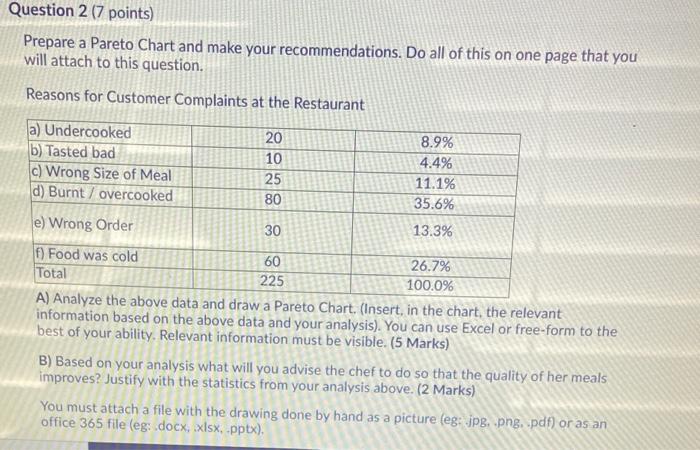
Question: Question 2 7 points) Prepare a Pareto Chart and make your recommendations. Do all of this on one page that you will attach to this

Question 2 7 points) Prepare a Pareto Chart and
Question 2 7 points) Prepare a Pareto Chart and make your recommendations. Do all of this on one page that you will attach to this question. Reasons for Customer Complaints at the Restaurant 20 8.9% a) Undercooked b) Tasted bad c) Wrong Size of Meal d) Burnt 7 overcooked 10 25 4.4% 11.1% 35.6% 80 e) Wrong Order 30 13.3% f) Food was cold 60 26.7% Total 225 100.0% A) Analyze the above data and draw a Pareto Chart, (Insert, in the chart, the relevant information based on the above data and your analysis). You can use Excel or free-form to the best of your ability. Relevant information must be visible. (5 Marks) B) Based on your analysis what will you advise the chef to do so that the quality of her meals improves? Justify with the statistics from your analysis above. (2 Marks) You must attach a file with the drawing done by hand as a picture (eg: jpg, png, .pdf) or as an office 365 file (eg: docx, .xlsx, .pptx)

Step by Step Solution

There are 3 Steps involved in it

1 Expert Approved Answer
Step: 1 Unlock blur-text-image
Question Has Been Solved by an Expert!

Get step-by-step solutions from verified subject matter experts

Step: 2 Unlock
Step: 3 Unlock

Students Have Also Explored These Related General Management Questions!