

Question: Question 2 7 pts 1 Details The table below shows a stem-and-leaf diagram for a sample of test scores of students in Liberal Arts
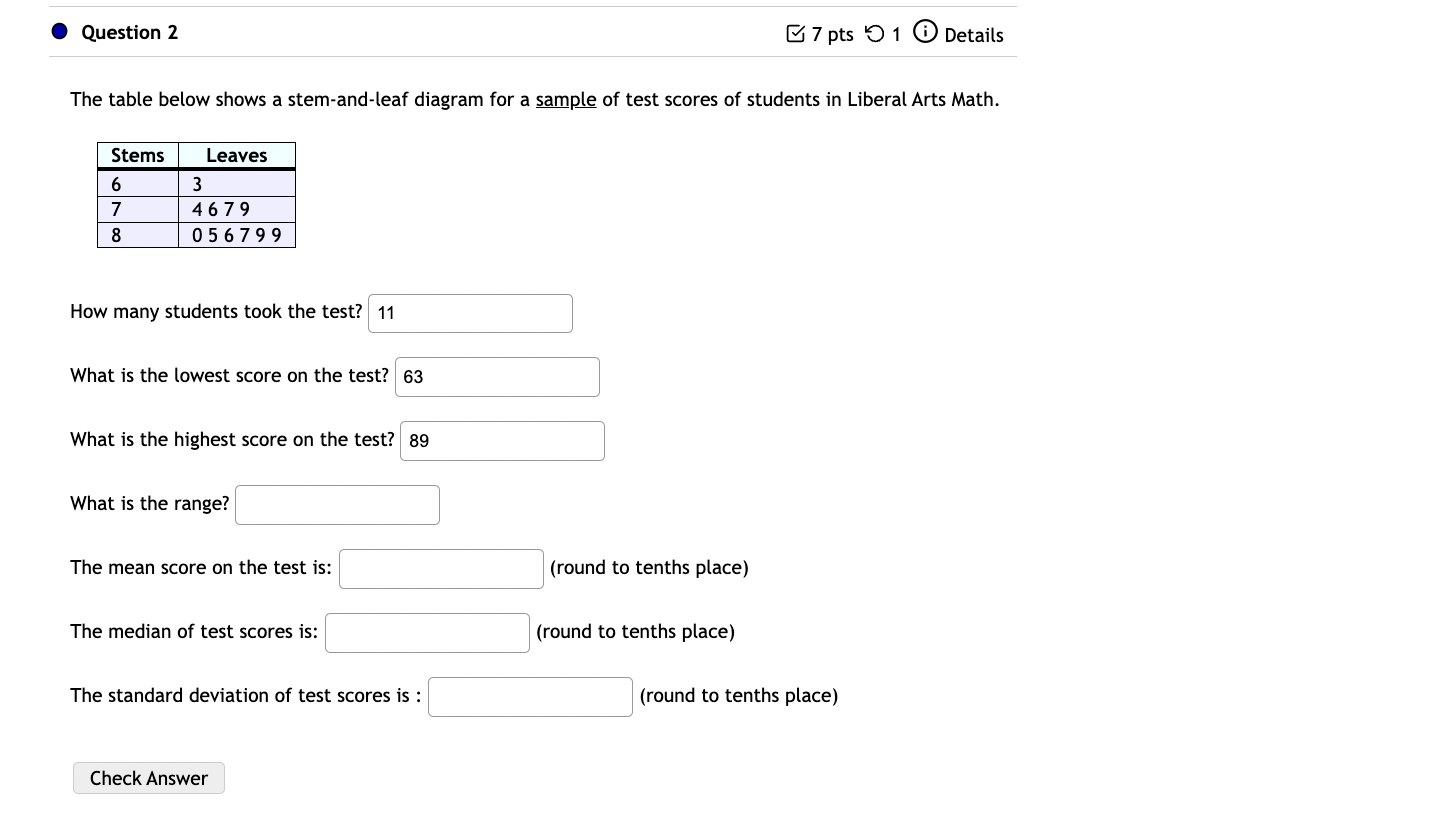
Question 2 7 pts 1 Details The table below shows a stem-and-leaf diagram for a sample of test scores of students in Liberal Arts Math. Stems 6 Leaves 3 7 8 4679 056799 How many students took the test? 11 What is the lowest score on the test? 63 What is the highest score on the test? 89 What is the range? The mean score on the test is: The median of test scores is: The standard deviation of test scores is : Check Answer (round to tenths place) (round to tenths place) (round to tenths place)
Step by Step Solution
There are 3 Steps involved in it
1 Expert Approved Answer
Step: 1 Unlock

Question Has Been Solved by an Expert!
Get step-by-step solutions from verified subject matter experts
Step: 2 Unlock
Step: 3 Unlock