

Question: The table below shows a stem-and-leaf diagram for the test scores of students in Liberal Arts Math. Stems Leaves 5 78 6 0679 7 124569
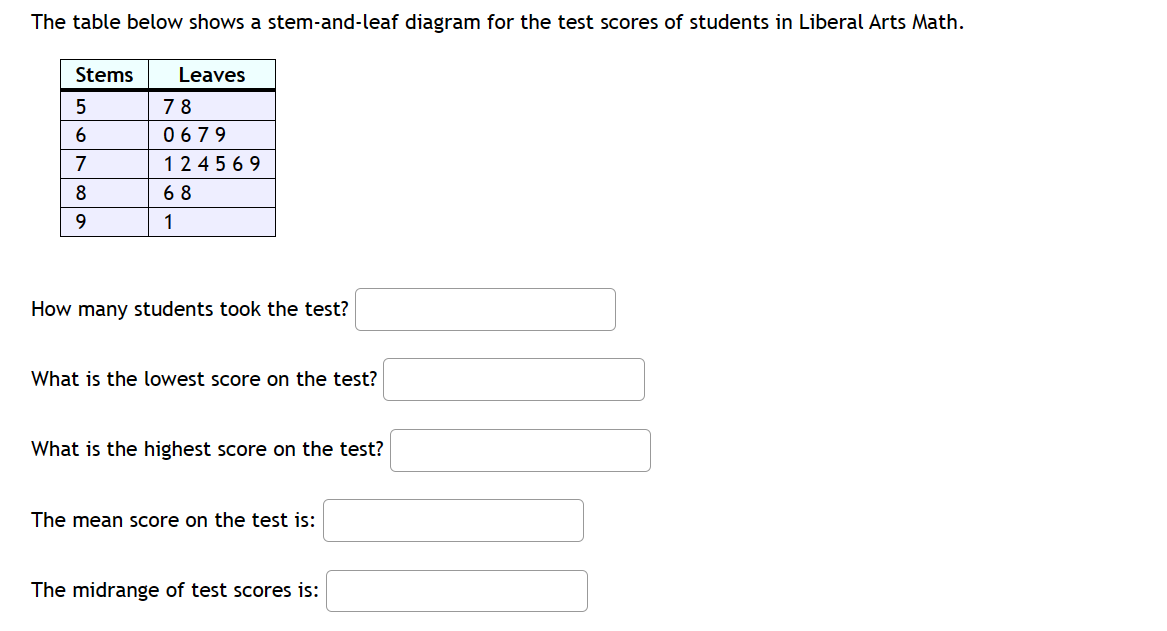
The table below shows a stem-and-leaf diagram for the test scores of students in Liberal Arts Math. Stems Leaves 5 78 6 0679 7 124569 8 68 9 1 How many students took the test? What is the lowest score on the test? What is the highest score on the test? The mean score on the test is: The midrange of test scores is
Step by Step Solution
There are 3 Steps involved in it
1 Expert Approved Answer
Step: 1 Unlock

Question Has Been Solved by an Expert!
Get step-by-step solutions from verified subject matter experts
Step: 2 Unlock
Step: 3 Unlock