

Question: Question 2 A . ( 5 points ) Using the inputs from Question 1 , increase the desired inventory fill - rate to 9 7
Question
A points Using the inputs from Question increase the desired inventory fillrate to recalculate the inputs, performance measures, cost measures, and inventory policy settings including the EOQ
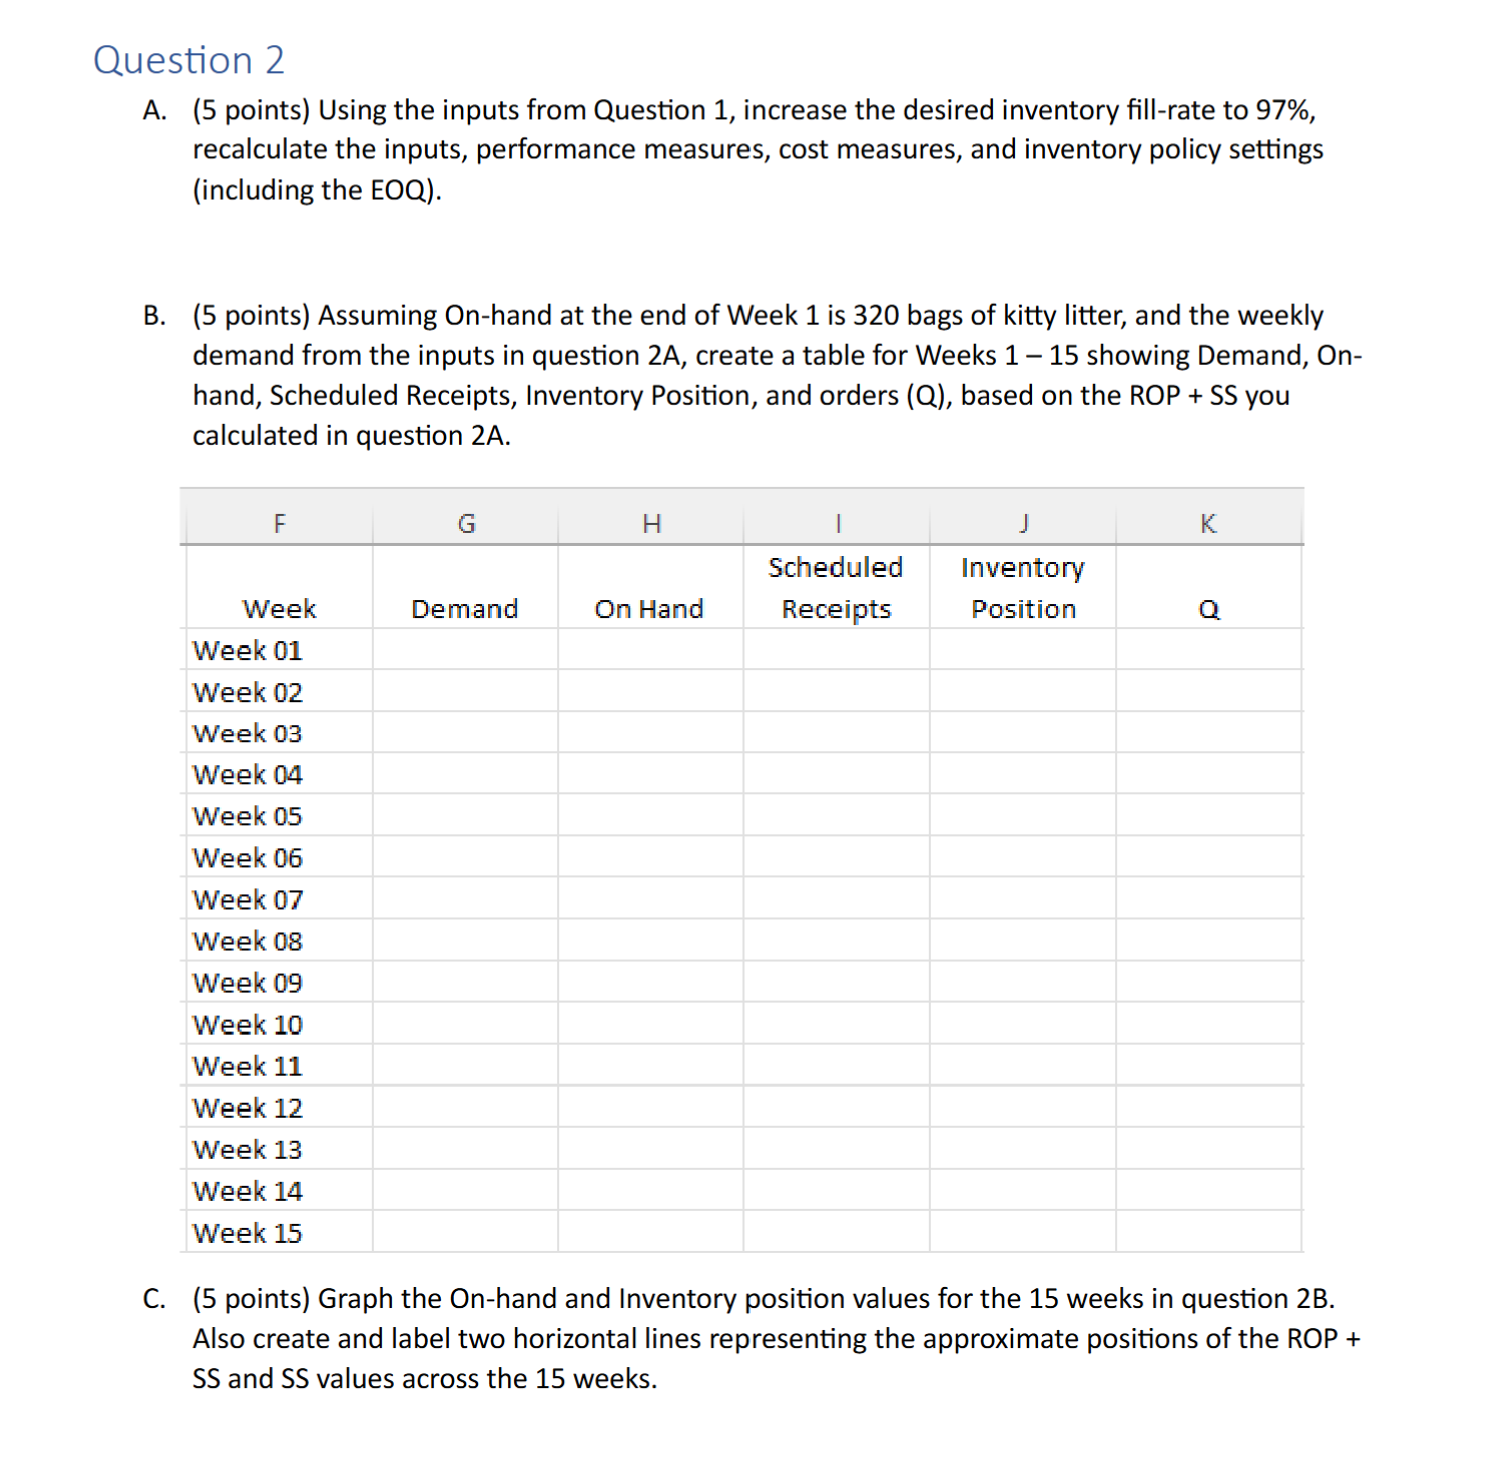
B points Assuming Onhand at the end of Week is bags of kitty litter, and the weekly demand from the inputs in question A create a table for Weeks showing Demand, Onhand, Scheduled Receipts, Inventory Position, and orders Q based on the ROP SS you calculated in question A
begintabularcccccc
hline F & G & H & I & J & K
hline Week & Demand & On Hand & begintabularl
Scheduled
Receipts
endtabular & begintabularl
Inventory
Position
endtabular & Q
hline Week & & & & &
hline Week & & & & &
hline Week & & & & &
hline Week & & & & &
hline Week & & & & &
hline Week & & & & &
hline Week & & & & &
hline Week & & & & &
hline Week & & & & &
hline Week & & & & &
hline Week & & & & &
hline Week & & & & &
hline Week & & & & &
hline Week & & & & &
hline Week & & & & &
hline
endtabular
C points Graph the Onhand and Inventory position values for the weeks in question B Also create and label two horizontal lines representing the approximate positions of the ROP SS and SS values across the weeks.
Step by Step Solution
There are 3 Steps involved in it
1 Expert Approved Answer
Step: 1 Unlock

Question Has Been Solved by an Expert!
Get step-by-step solutions from verified subject matter experts
Step: 2 Unlock
Step: 3 Unlock