

Question: QUESTION 2 A survey was conducted to determine the number of hours homemakers spent on television programs per week. A sample of n = 40
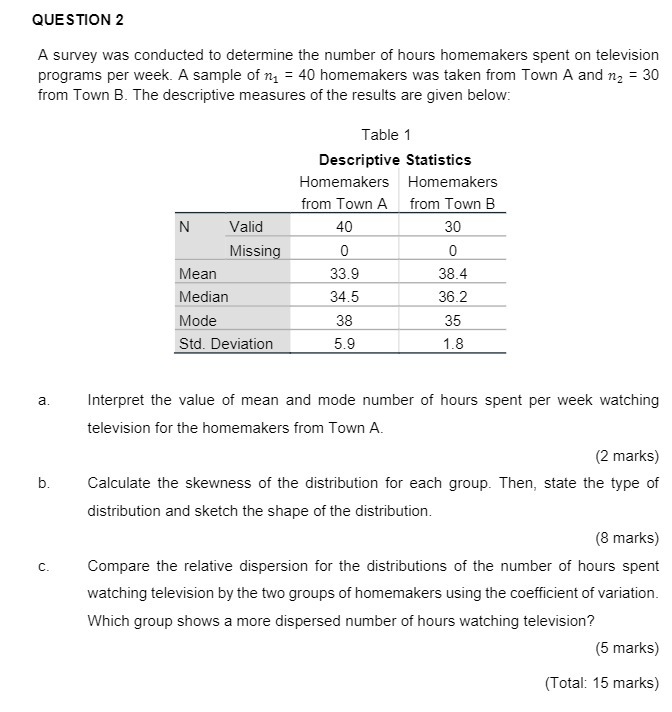

QUESTION 2 A survey was conducted to determine the number of hours homemakers spent on television programs per week. A sample of n = 40 homemakers was taken from Town A and n2 = 30 from Town B. The descriptive measures of the results are given below: Table 1 Descriptive Statistics Homemakers Homemakers from Town A from Town B N Valid 40 30 Missing 0 0 Mean 33.9 38.4 Median 34.5 36.2 Mode 38 35 Std. Deviation 5.9 1.8 a. Interpret the value of mean and mode number of hours spent per week watching television for the homemakers from Town A. (2 marks) b. Calculate the skewness of the distribution for each group. Then, state the type of distribution and sketch the shape of the distribution. (8 marks) C. Compare the relative dispersion for the distributions of the number of hours spent watching television by the two groups of homemakers using the coefficient of variation. Which group shows a more dispersed number of hours watching television? (5 marks) (Total: 15 marks)
Step by Step Solution
There are 3 Steps involved in it

Get step-by-step solutions from verified subject matter experts