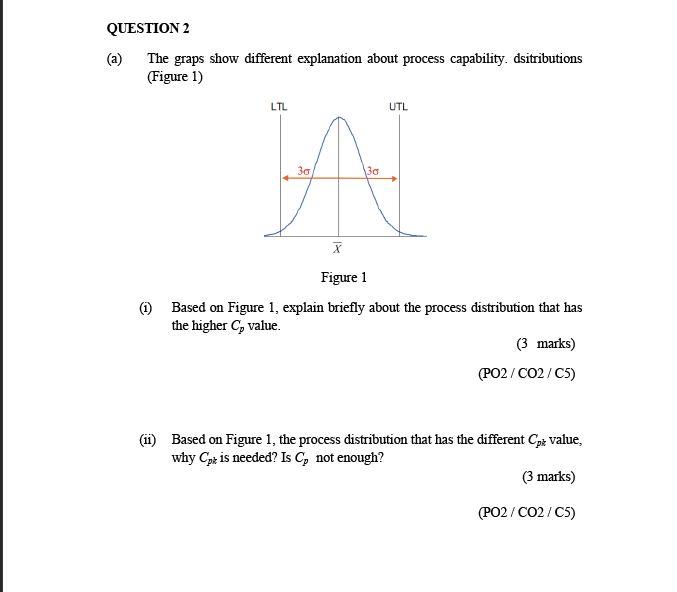
Question: QUESTION 2 (a) The graps show different explanation about process capability. dsitributions (Figure 1) LTL UTL 30 30 X Figure 1 Based on Figure 1,

QUESTION 2 (a) The graps show different

QUESTION 2 (a) The graps show different explanation about process capability. dsitributions (Figure 1) LTL UTL 30 30 X Figure 1 Based on Figure 1, explain briefly about the process distribution that has the higher C value. (3 marks) (PO2 / CO2 / C5) (11) Based on Figure 1, the process distribution that has the different Cpt value, why Cpix is needed? Is C, not enough? (3 marks) (PO2 / CO2 / C5)

Step by Step Solution

There are 3 Steps involved in it

1 Expert Approved Answer
Step: 1 Unlock blur-text-image
Question Has Been Solved by an Expert!

Get step-by-step solutions from verified subject matter experts

Step: 2 Unlock
Step: 3 Unlock

Students Have Also Explored These Related General Management Questions!