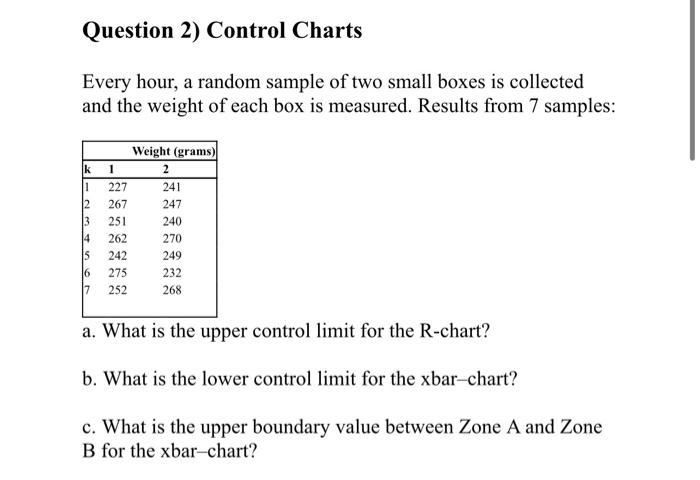
Question: Question 2) Control Charts Every hour, a random sample of two small boxes is collected and the weight of each box is measured. Results from

Question 2) Control Charts Every hour, a random
Question 2) Control Charts Every hour, a random sample of two small boxes is collected and the weight of each box is measured. Results from 7 samples: Weight (grams) k 1 1 227 2 241 2 267 247 3 251 240 262 270 14 IS 242 249 16 275 232 17252 268 a. What is the upper control limit for the R-chart? b. What is the lower control limit for the xbar-chart? c. What is the upper boundary value between Zone A and Zone B for the xbar-chart? Control Chart Factors Sample Size Factor for X bar-chart Factors for R-chart Factors for R-chart D3 1.880 0.000 n A2 D4 2 3.267 3 1.023 0.000 2.575 4 0.729 2.282 5 0.577 2.114 0.000 0.000 0.000 0.076 6 0.483 7 0.419 0.373 2.004 1.924 1.864 8 0.136 9 0.337 0.184 1.816 10 0.308 0.223 1.777 11 0.285 0.256 1.744 12 0.266 0.283 1.717 1.693 13 0.249 0.307

Step by Step Solution

There are 3 Steps involved in it

1 Expert Approved Answer
Step: 1 Unlock blur-text-image
Question Has Been Solved by an Expert!

Get step-by-step solutions from verified subject matter experts

Step: 2 Unlock
Step: 3 Unlock

Students Have Also Explored These Related General Management Questions!