

Question: Question 2 Examine Figure 1 , which presents a Statistical Process Control ( SPC ) chart for the fitting of the steering wheel at FBC
Question
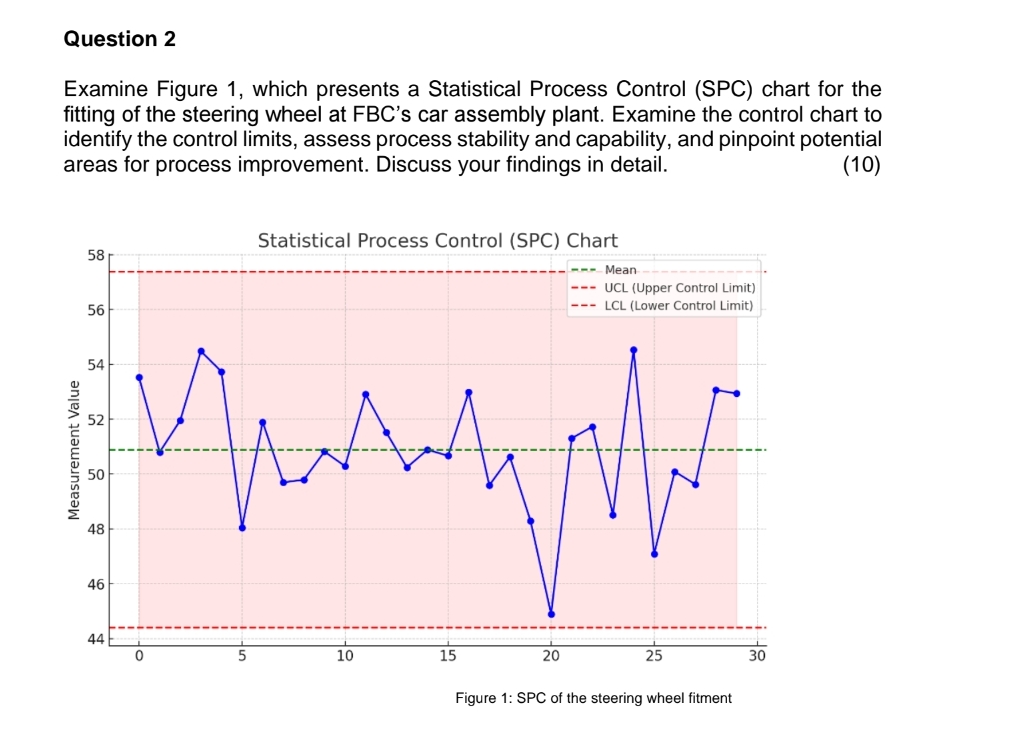
Examine Figure which presents a Statistical Process Control SPC chart for the fitting of the steering wheel at FBCs car assembly plant. Examine the control chart to identify the control limits assess process stability and capability, and pinpoint potential areas for process improvement. Discuss your findings in detail.
Step by Step Solution
There are 3 Steps involved in it
1 Expert Approved Answer
Step: 1 Unlock

Question Has Been Solved by an Expert!
Get step-by-step solutions from verified subject matter experts
Step: 2 Unlock
Step: 3 Unlock