

Question: Question 2: Explanation of Statistical Calculations Using the Calculating Statistic spreadsheet and your text book write the formulas and describe the calculations for the following
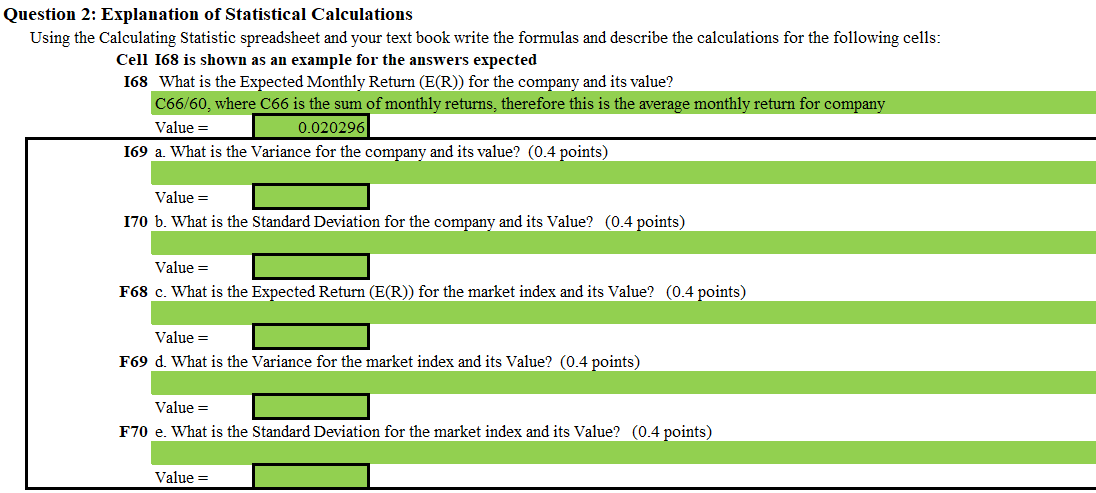
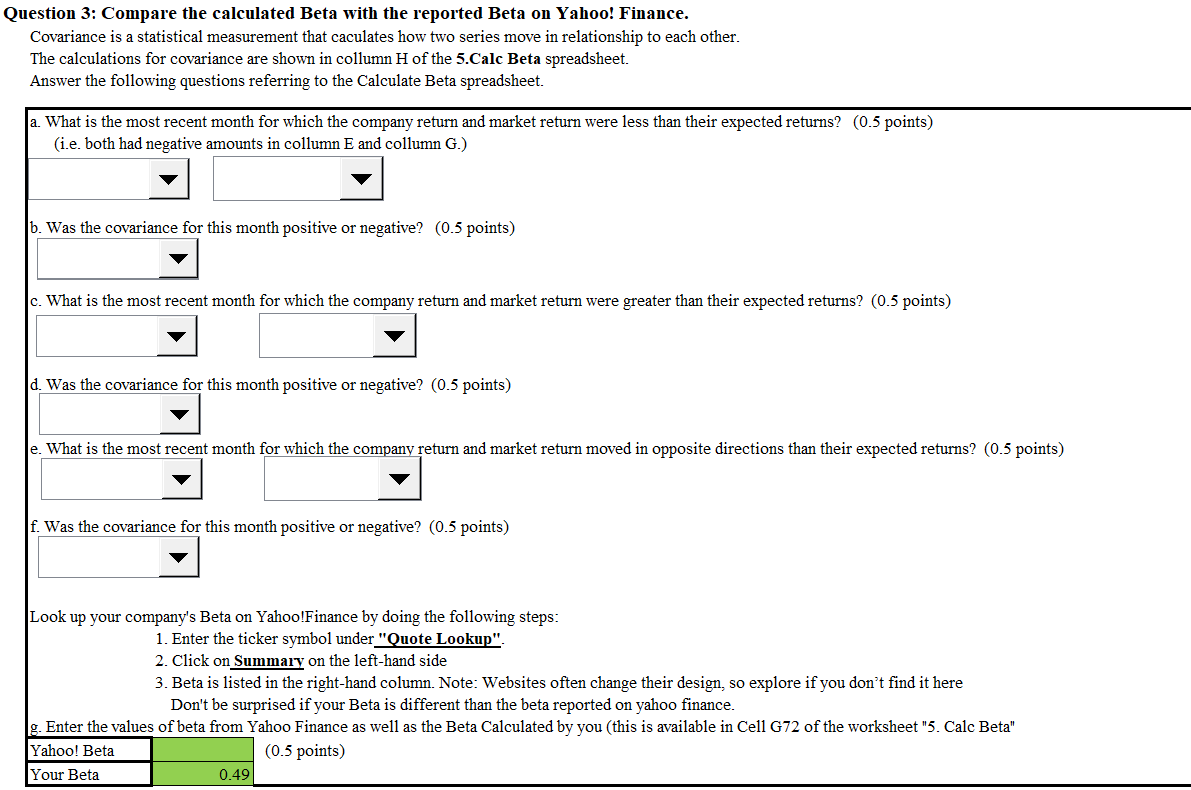
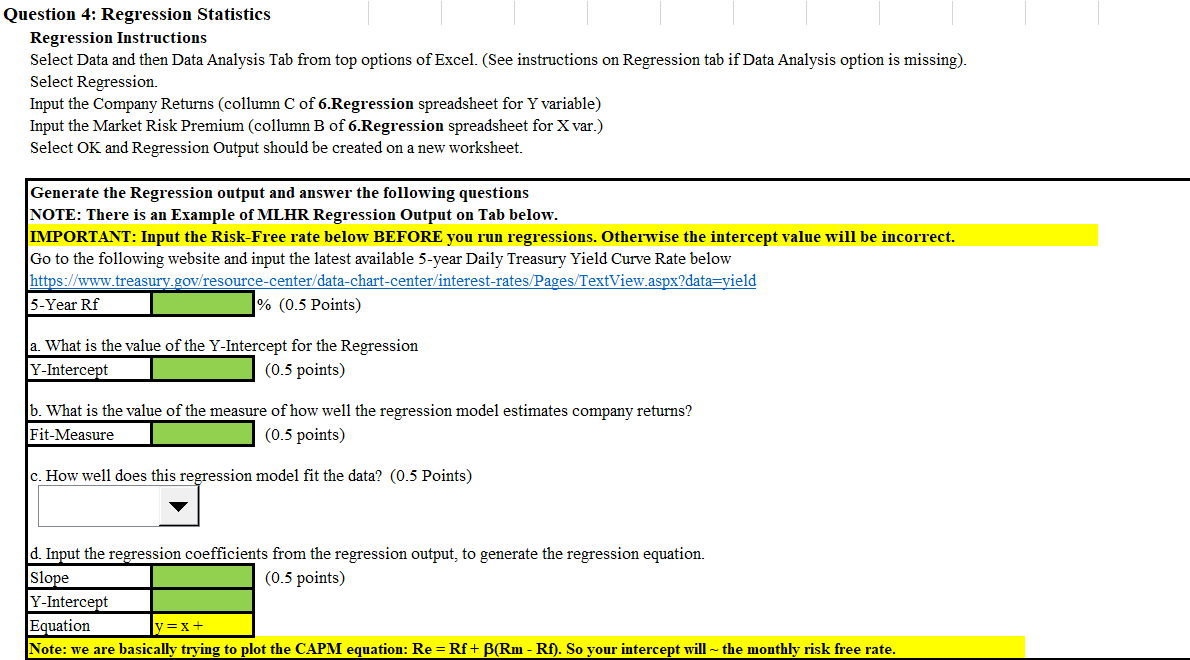
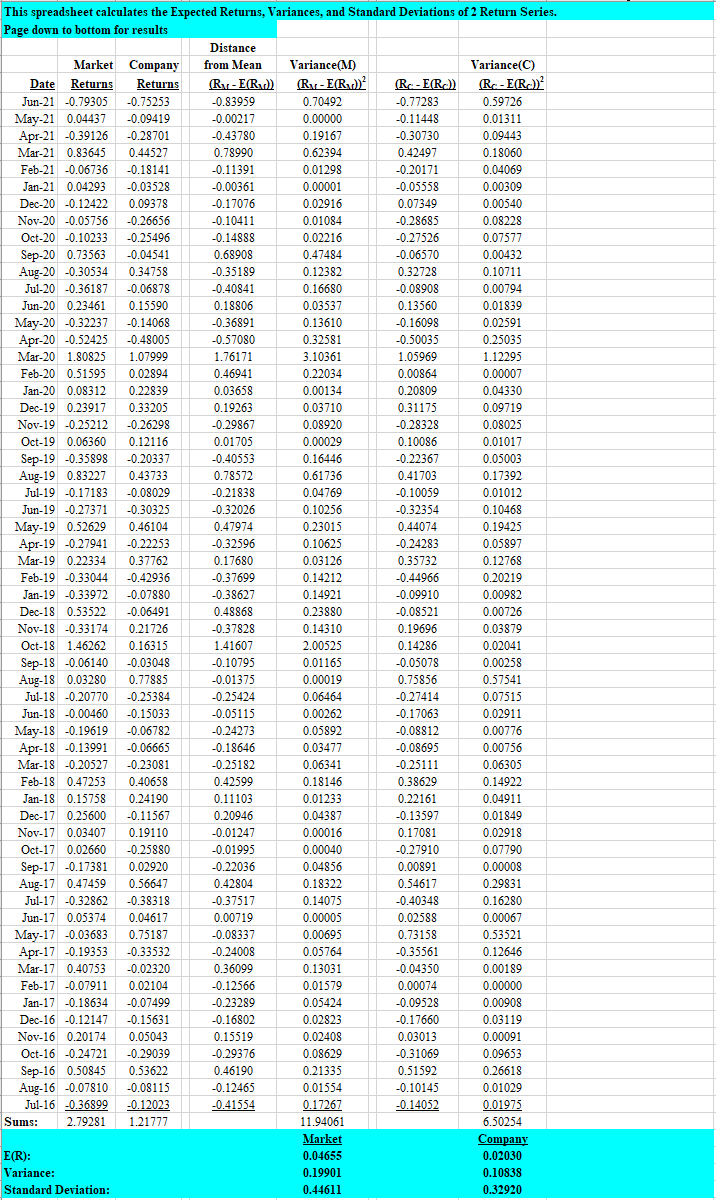
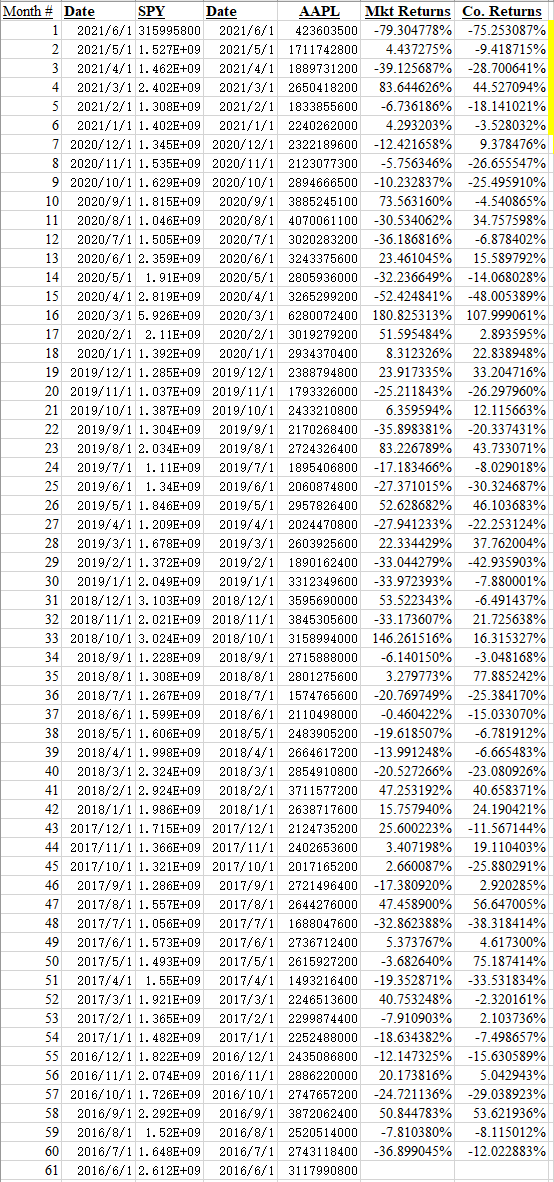
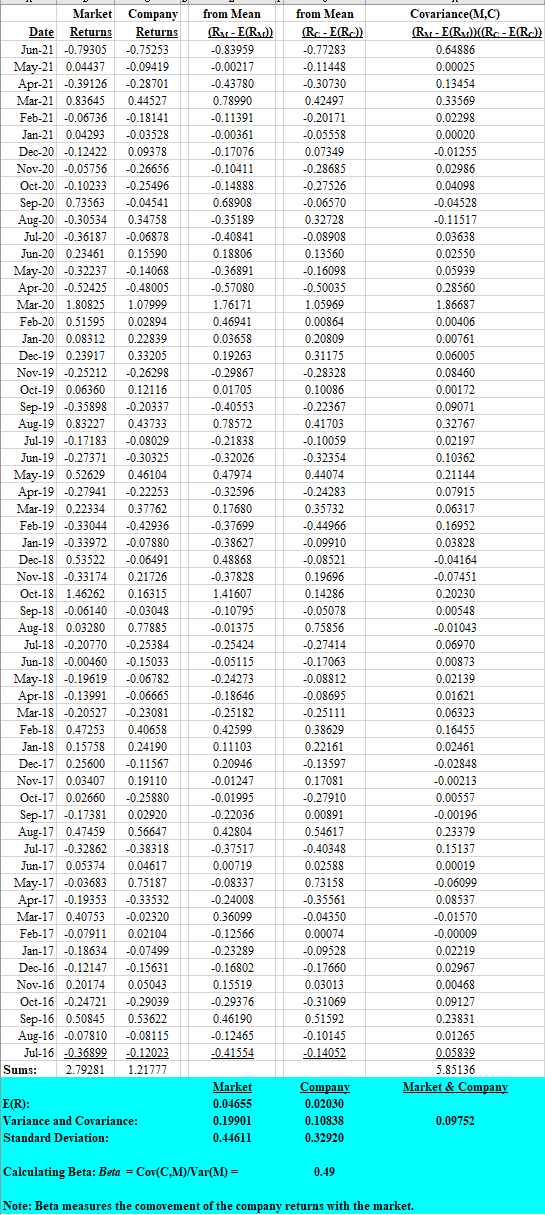
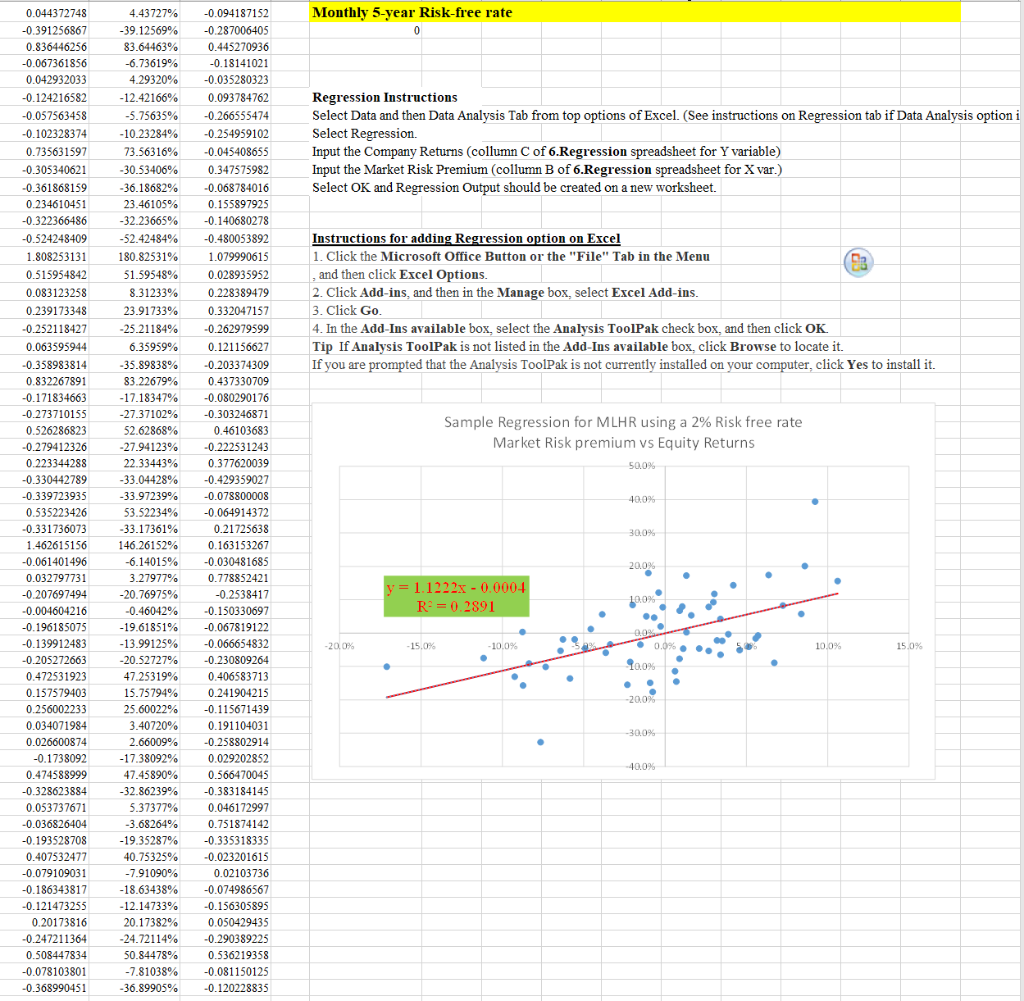
Question 2: Explanation of Statistical Calculations Using the Calculating Statistic spreadsheet and your text book write the formulas and describe the calculations for the following cells: Cell 168 is shown as an example for the answers expected 168 What is the Expected Monthly Return (E(R)) for the company and its value? C66/60, where C66 is the sum of monthly returns, therefore this is the average monthly return for company Value = 0.020296 169 a. What is the Variance for the company and its value? (0.4 points) Value = 170 b. What is the Standard Deviation for the company and its Value? (0.4 points) Value = F68 c. What is the Expected Return (E(R)) for the market index and its Value? (0.4 points) Value = F69 d. What is the Variance for the market index and its Value? (0.4 points) Value = F70 e. What is the Standard Deviation for the market index and its Value? (0.4 points) Value = Question 4: Regression Statistics Regression Instructions Select Data and then Data Analysis Tab from top options of Excel. (See instructions on Regression tab if Data Analysis option is missing). Select Regression. Input the Company Returns (collumn C of 6.Regression spreadsheet for Y variable) Input the Market Risk Premium (collumn B of 6.Regression spreadsheet for X var.) Select OK and Regression Output should be created on a new worksheet. Generate the Regression output and answer the following questions NOTE: There is an Example of MLHR Regression Output on Tab below. IMPORTANT: Input the Risk-Free rate below BEFORE you run regressions. Otherwise the intercept value will be incorrect. Go to the following website and input the latest available 5-year Daily Treasury Yield Curve Rate below https://www.treasury.gov/resource-center/data-chart-center/interest-rates/Pages/TextView.aspx?data=yield 5-Year Rf 1% (0.5 Points) a. What is the value of the Y-Intercept for the Regression Y-Intercept (0.5 points) b. What is the value of the measure of how well the regression model estimates company returns? Fit-Measure (0.5 points) c. How well does this regression model fit the data? (0.5 Points) d. Input the regression coefficients from the regression output, to generate the regression equation. Slope (0.5 points) Y-Intercept Equation ly=x+ Note: we are basically trying to plot the CAPM equation: Re =Rf+B(Rm - Rf). So your intercept will -- the monthly risk free rate. This spreadsheet calculates the Expected Returns, Variances, and Standard Deviations of 2 Return Series. Page down to bottom for results Distance Market Company from Mean Variance(M) Variance(C) Date Returns Returns (Ry - E(R)) (Ry - E(R) (RC-E(R.)) (R-ER.) Jun-21 -0.79305 -0.75253 -0.83959 0.70492 -0.77283 0.59726 May-21 0.04437 -0.09419 -0.00217 0.00000 -0.11448 0.01311 Apr-21 -0.39126 -0.28701 -0.43780 0.19167 -0.30730 0.09443 Mar-21 0.83645 0.44527 0.78990 0.62394 0.42497 0.18060 Feb-21 -0.06736 -0.18141 -0.11391 0.01298 -0.20171 0.04069 Jan-21 0.04293 -0.03528 -0.00361 0.00001 -0.05558 0.00309 Dec-20 -0.12422 0.09378 -0.17076 0.02916 0.07349 0.00540 Nov-20 -0.05756 -0.26656 -0.10411 0.01084 -0.28685 0.08228 Oct-20 -0.10233 -0.25496 -0.14888 0.02216 -0.27526 0.07577 Sep-20 0.73563 -0.04541 0.68908 0.47484 -0.06570 0.00432 Aug-20 -0.30534 0.34758 -0.35189 0.12382 0.32728 0.10711 Jul-20 -0.36187 -0.06878 -0.40841 0.16680 -0.08908 0.00794 Jun-20 0.23461 0.15590 0.18806 0.03537 0.13560 0.01839 May-20 -0.32237 -0.14068 -0.36891 0.13610 -0.16098 0.02591 Apr-20 -0.52425 -0.48005 -0.57080 0.32581 -0.50035 0.25035 Mar-20 1.80825 1.07999 1.76171 3.10361 1.05969 1.12295 Feb-20 0.51595 0.02894 0.46941 0.22034 0.00864 0.00007 Jan-20 0.08312 0.22839 0.03658 0.00134 0.20809 0.04330 Dec-19 0.23917 0.33205 0.19263 0.03710 0.31175 0.09719 Nov-19 -0.25212 -0.26298 -0.29867 0.08920 -0.28328 0.08025 Oct-19 0.06360 0.12116 0.01705 0.00029 0.10086 0.01017 Sep-19 -0.35898 -0.20337 -0.40553 0.16446 -0.22367 0.05003 Aug-19 0.83227 0.43733 0.78572 0.61736 0.41703 0.17392 Jul-19 -0.17183 -0.08029 -0.21838 0.04769 -0.10059 0.01012 Jun-19 -0.27371 -0.30325 -0.32026 0.10256 -0.32354 0.10468 May-19 0.52629 0.46104 0.47974 0.23015 0.44074 0.19425 Apr-19 -0.27941 -0.22253 -0.32596 0.10625 -0.24283 0.05897 Mar-19 0.22334 0.37762 0.17680 0.03126 0.35732 0.12768 Feb-19 -0.33044 -0.42936 -0.37699 0.14212 -0.44966 0.20219 Jan-19 -0.33972 -0.07880 -0.38627 0.14921 -0.09910 0.00982 Dec-18 0.53522 -0.06491 0.48868 0.23880 -0.08521 0.00726 Nov-18 -0.33174 0.21726 -0.37828 0.14310 0.19696 0.03879 Oct-18 1.46262 0.16315 1.41607 2.00525 0.14286 0.02041 Sep-18 -0.06140 -0.03048 -0.10795 0.01165 -0.05078 0.00258 Aug-18 0.03280 0.77885 -0.01375 0.00019 0.75856 0.57541 Jul-18 -0.20770 -0.25384 -0.25424 0.06464 -0.27414 0.07515 Jun-18 -0.00460 -0.15033 -0.05115 0.00262 -0.17063 0.02911 May-18 -0.19619 -0.06782 -0.24273 0.05892 -0.08812 0.00776 Apr-18 -0.13991 -0.06665 -0.18646 0.03477 0.00756 Mar-18 -0.20527 -0.23081 -0.25182 0.06341 -0.25111 0.06305 Feb-18 0.47253 0.40658 0.42599 0.18146 0.38629 0.14922 Jan-18 0.15758 0.24190 0.11103 0.01233 0.22161 0.04911 Dec-17 0.25600 -0.11567 0.20946 0.04387 -0.13597 0.01849 Nov-17 0.03407 0.19110 -0.01247 0.00016 0.17081 0.02918 Oct-17 0.02660 -0.25880 -0.01995 0.00040 -0.27910 0.07790 Sep-17 -0.17381 0.02920 -0.22036 0.04856 0.00891 0.00008 Aug-17 0.47459 0.56647 0.42804 0.18322 0.54617 0.29831 Jul-17 -0.32862 -0.38318 -0.37517 0.14075 -0.40348 0.16280 Jun-17 0.05374 0.04617 0.00719 0.00005 0.02588 0.00067 May-17 -0.03683 0.75187 -0.08337 0.00695 0.73158 0.53521 Apr-17 -0.19353 -0.33532 -0.24008 0.05764 -0.35561 0.12646 Mar-17 0.40753 -0.02320 0.36099 0.13031 -0.04350 0.00189 Feb-17 -0.07911 0.02104 -0.12566 0.01579 0.00074 0.00000 Jan-17 -0.18634 -0.07499 -0.23289 0.05424 -0.09528 0.00908 Dec-16 -0.12147 -0.15631 -0.16802 0.02823 -0.17660 0.03119 Nov-16 0.20174 0.05043 0.15519 0.02408 0.03013 0.00091 Oct-16 -0.24721 -0.29039 -0.29376 0.08629 -0.31069 0.09653 Sep-16 0.50845 0.53622 0.46190 0.21335 0.51592 0.26618 Aug-16 -0.07810 -0.08115 -0.12465 0.01554 -0.10145 0.01029 Jul-16 -0.36899 -0.12023 -0.41554 0.17267 -0.14052 0.01975 Sums: 2.79281 1.21777 11.94061 6.50254 Market Company E(R): 0.04655 0.02030 Variance: 0.19901 0.10838 Standard Deviation: 0.44611 0.32920 -0.08695 Month# Date SPY Date AAPL Mkt Returns Co. Returns 1 2021/6/1 315995800 2021/6/1 423603500 -79.304778% -75.253087% 2 2021/5/1 1.527E+09 2021/5/1 1711742800 4.437275% -9.418715% 3 2021/4/1 1.462E+09 2021/4/1 1889731200 -39.125687% -28.700641% 4 2021/3/1 2.402E+09 2021/3/1 2650418200 83.644626% 44.527094% 5 2021/2/1 1. 308E+09 2021/2/1 1833855600 -6.736186% -18.141021% 6 2021/1/1 1.402E+09 2021/1/1 2240262000 4.293203% -3.528032% 7 2020/12/1 1. 345E+09 2020/12/1 2322189600 -12.421658% 9.378476% 8 2020/11/1 1.535E+09 2020/11/1 2123077300 -5.756346% -26.655547% 9 2020/10/1 1.629E+09 2020/10/1 2894666500 -10.232837% -25.495910% 10 2020/9/1 1.815E+09 2020/9/1 3885245100 73.563160% -4.540865% 11 2020/8/1 1.046E+09 2020/8/1 4070061100 -30.534062% 34.757598% 12 2020/7/1 1. 505E+09 2020/7/1 3020283200 -36.186816% -6.878402% 13 2020/6/1 2. 359E+09 2020/6/1 3243375600 23.461045% 15.589792% 14 2020/5/1 1.91E+09 2020/5/1 2805936000 -32.236649% -14.068028% 15 2020/4/1 2. 819E+09 2020/4/1 3265299200 -52.424841% -48.005389% 16 2020/3/1 5. 926E+09 2020/3/1 6280072400 180.825313% 107.999061% 17 2020/2/1 2. 11E+09 2020/2/1 3019279200 51.595484% 2.893595% 18 2020/1/1 1. 392E+09 2020/1/1 2934370400 8.312326% 22.838948% 19 2019/12/1 1.285E+09 2019/12/1 2388794800 23.917335% 33.204716% 20 2019/11/1 1.037E+09 2019/11/1 1793326000 -25.211843% -26.297960% 21 2019/10/1 1.387E+09 2019/10/1 2433210800 6.359594% 12.115663% 22 2019/9/1 1.304E+09 2019/9/1 2170268400 -35.898381% -20.337431% 23 2019/8/1 2. 034E+09 2019/8/1 2724326400 83.226789% 43.733071% 24 2019/7/1 1.11E+09 2019/7/1 1895406800 -17.183466% -8.029018% 25 2019/6/1 1.34E+09 2019/6/1 2060874800 -27.371015% -30.324687% 26 2019/5/1 1. 846E+09 2019/5/1 2957826400 52.628682% 46.103683% 27 2019/4/1 1. 209E+09 2019/4/1 2024470800 -27.941233% -22.253124% 28 2019/3/1 1.678E+09 2019/3/1 2603925600 22.334429% 37.762004% 29 2019/2/1 1.372E+09 2019/2/1 1890162400 -33.044279% 42.935903% 30 2019/1/1 2. 049E+09 2019/1/1 3312349600 -33.972393% -7.880001% 31 2018/12/1 3. 103E+09 2018/12/1 3595690000 53.522343% -6.491437% 32 2018/11/1 2.021E+09 2018/11/1 3845305600 -33.173607% 21.725638% 33 2018/10/1 3.024E+09 2018/10/1 3158994000 146.261516% 16.315327% 34 2018/9/1 1.228E+09 2018/9/1 2715888000 -6.140150% -3.048168% 35 2018/8/1 1. 308E+09 2018/8/1 2801275600 3.279773% 77.885242% 36 2018/7/1 1.267E+09 2018/7/1 1574765600 -20.769749% -25.384170% 37 2018/6/1 1.599E+09 2018/6/1 2110498000 -0.460422% -15.033070% 38 2018/5/1 1. 606E+09 2018/5/1 2483905200 -19.618507% -6.781912% 39 2018/4/1 1.998E+09 2018/4/1 2664617200 -13.991248% -6.665483% 40 2018/3/1 2. 324E+09 2018/3/1 2854910800 -20.527266% -23.080926% 41 2018/2/1 2.924E+09 2018/2/1 3711577200 47.253192% 40.658371% 42 2018/1/1 1.986E+09 2018/1/1 2638717600 15.757940% 24.190421% 43 2017/12/1 1.715E+09 2017/12/1 2124735200 25.600223% -11.567144% 44 2017/11/1 1.366E+09 2017/11/1 2402653600 3.407198% 19.110403% 45 2017/10/1 1.321E+09 2017/10/1 2017165200 2.660087% -25.880291% 46 2017/9/1 1.286E+09 2017/9/1 2721496400 -17.380920% 2.920285% 47 2017/8/1 1.557E+09 2017/8/1 2644276000 47.458900% 56.647005% 48 2017/7/1 1.056E+09 2017/7/1 1688047600 -32.862388% -38.318414% 49 2017/6/1 1.573E+09 2017/6/1 2736712400 5.373767% 4.617300% 50 2017/5/1 1.493E+09 2017/5/1 2615927200 -3.682640% 75.187414% 51 2017/4/1 1.55E+09 2017/4/1 1493216400 -19.352871% -33.531834% 52 2017/3/1 1.921E+09 2017/3/1 2246513600 40.753248% -2.320161% 53 2017/2/1 1.365E+09 2017/2/1 2299874400 -7.910903% 2.103736% 54 2017/1/1 1. 482E+09 2017/1/1 2252488000 -18.634382% -7.498657% 55 2016/12/1 1. 822E+09 2016/12/1 2435086800 -12.147325% -15.630589% 56 2016/11/1 2. 074E+09 2016/11/1 2886220000 20.173816% 5.042943% 57 2016/10/1 1. 726E+09 2016/10/1 2747657200 -24.721136% -29.038923% 58 2016/9/1 2. 292E+09 2016/9/1 3872062400 50.844783% 53.621936% 59 2016/8/1 1.52E+09 2016/8/1 2520514000 -7.810380% -8.115012% 60 2016/7/1 1.648E+09 2016/7/1 2743118400 -36.899045% -12.022883% 61 2016/6/1 2. 612E+09 2016/6/1 3117990800 from Mean from Mean (RA-E(R)) Covariance(MC) (Ry - E(RX)X(RC-E(R)) 0.64886 -0.83959 -0.00217 (RC-E(R)) -0.77283 -0.11448 -0.30730 0.42497 -0.43780 0.78990 Market Company Date Returns Returns Jun-21 -0.79305 -0.75253 May-21 0.04437 -0.09419 Apr-21 -0.39126 -0.28701 Mar-21 0.83645 0.44527 Feb-21 -0.06736 -0.18141 Jan-21 0.04293 -0.03528 Dec-20 -0.12422 0.09378 Nov-20 -0.05756 -0.26656 Oct-20 -0.10233 -0.25496 Sep-20 0.73563 -0.04541 Aug-20 -0.30534 0.34758 0.00025 0.13454 0.33569 0.02298 0.00020 -0.11391 -0.20171 -0.00361 -0.17076 -0.05558 0.07349 -0.28685 -0.01255 -0.10411 0.02986 -0.14888 -0.27526 0.04098 0.68908 -0.06570 -0.04528 0.32728 -0.11517 Jul-20 -0.36187 -0.06878 -0.08908 0.03638 -0.35189 -0.40841 0.18806 -0.36891 Jun-20 0.23461 May-20 -0.32237 Apr-20 -0.52425 Mar-20 1.80825 0.02550 0.05939 0.15590 -0.14068 -0.48005 1.07999 0.13560 -0.16098 -0.50035 -0.57080 0.28560 1.76171 1.05969 Feb-20 0.51595 0.02894 0.46941 0.00864 0.22839 0.03658 0.19263 0.20809 0.31175 1.86687 0.00406 0.00761 0.06005 0.08460 0.00172 0.09071 -0.29867 0.33205 -0.26298 0.12116 -0.20337 0.43733 -0.28328 0.01705 -0.40553 0.78572 0.10086 -0.22367 0.41703 0.32767 -0.08029 -0.21838 -0.10059 0.02197 Jan-20 0.08312 Dec-19 0.23917 Nov-19 -0.25212 Oct-19 0.06360 Sep-19 -0.35898 Aug-19 0.83227 Jul-19 -0.17183 Jun-19 -0.27371 May-19 0.52629 Apr-19 -0.27941 Mar-19 0.22334 Feb-19 -0.33044 Jan-19 -0.33972 Dec-18 0.53522 Nov-18 -0.33174 -0.32026 0.10362 0.21144 -0.30325 0.46104 -0.22253 0.37762 0.47974 -0.32596 0.17680 -0.32354 0.44074 -0.24283 0.35732 0.07915 0.06317 -0.42936 -0.37699 -0.44966 0.16952 -0.09910 0.03828 -0.07880 -0.06491 -0.04164 0.21726 -0.07451 -0.38627 0.48868 -0.37828 1.41607 -0.10795 -0.01375 Oct-18 1.46262 0.16315 0.20230 0.00548 -0.03048 Sep-18 -0.06140 Aug-18 0.03280 Jul-18 -0.20770 0.77885 -0.01043 -0.25384 -0.25424 0.06970 Jun-18 -0.00460 -0.15033 -0.05115 -0.08521 0.19696 0.14286 -0.05078 0.75856 -0.27414 -0.17063 -0.08812 -0.08695 -0.25111 0.38629 0.22161 -0.13597 0.00873 -0.06782 0.02139 0.01621 -0.06665 -0.2308 0.40658 0.24190 May-18 -0.19619 Apr-18 -0.13991 Mar-18 -0.20527 Feb-18 0.47253 Jan-18 0.15758 Dec-17 0.25600 Nov-17 0.03407 Oct-17 0.02660 Sep-17 -0.17381 Aug-17 0.47459 Jul-17 -0.32862 -0.24273 -0.18646 -0.25182 0.42599 0.11103 0.20946 -0.11567 0.19110 -0.01247 0.17081 -0.01995 -0.27910 -0.25880 0.02920 0.56647 0.00891 0.54617 0.06323 0.16455 0.02461 -0.02848 -0.00213 0.00557 -0.00196 0.23379 0.15137 0.00019 -0.06099 0.08537 -0.01570 -0.22036 0.42804 -0.37517 0.00719 -0.08337 -0.38318 -0.40348 Jun-17 0.05374 0.04617 0.02588 0.75187 0.73158 -0.24008 -0.35561 May-17 -0.03683 Apr-17 -0.19353 Mar-17 0.40753 Feb-17 -0.07911 -0.33532 -0.02320 -0.04350 0.02104 -0.00009 Jan-17 -0.18634 0.02219 Dec-16 -0.12147 Nov-16 0.20174 0.36099 -0.12566 -0.23289 -0.16802 0.15519 -0.29376 0.46190 -0.12465 -0.41554 0.02967 0.00468 0.00074 -0.09528 -0.17660 0.03013 -0.31069 0.51592 -0.10145 -0.14052 -0.07499 -0.15631 0.05043 -0.29039 0.53622 -0.08115 -0.12023 1.21777 Oct-16 -0.24721 0.09127 0.23831 0.01265 Sep-16 0.50845 Aug-16 -0.07810 Jul-16 -0.36899 Sums: 2.79281 0.05839 5.85136 Market & Company Company 0.02030 E(R): Variance and Covariance: Market 0.04655 0.19901 0.44611 0.10838 0.09752 Standard Deviation: 0.32920 Calculating Beta: Beta = Cov(CM)/Var(M)= 0.49 Note: Beta measures the comovement of the company returns with the market. 0.044372748 4.43727% -0.094187152 Monthly 5-year Risk-free rate -0.391256867 0 -0.287006405 0.445270936 0.836446256 -39.12569% 83.64463% -6.73619% 4.29320% -0.067361856 -0.18141021 0.042932033 -0.035280323 -0.124216582 -12.42166% 0.093784762 -0.057563458 -5.75635% -0.266555474 -0.102328374 -10.23284% -0.254959102 Regression Instructions Select Data and then Data Analysis Tab from top options of Excel. (See instructions on Regression tab if Data Analysis option i Select Regression Input the Company Returns (collumn C of 6.Regression spreadsheet for Y variable) Input the Market Risk Premium (collumn B of 6.Regression spreadsheet for X var.) Select OK and Regression Output should be created on a new worksheet. 0.735631597 73.56316% -0.045408655 -0.305340621 -30.53406% 0.347575982 -0.361868159 -36.18682% -0.068784016 0.234610451 23.46105% 0.155897925 -0.322366486 -32.23665% -0.140680278 -0.524248409 -52.42484% -0.480053892 1.808253131 180.82531% 1.079990615 0.515954842 51.59548% 0.028935952 0.228389479 0.083123258 8.31233% Instructions for adding Regression option on Excel 1. Click the Microsoft Office Button or the "File" Tab in the Menu Da and then click Excel Options. 2. Click Add-ins, and then in the Manage box, select Excel Add-ins. 3. Click Go. 4. In the Add-Ins available box, select the Analysis ToolPak check box, and then click OK. Tip If Analysis ToolPak is not listed in the Add-Ins available box, click Browse to locate it. If you are prompted that the Analysis ToolPak is not currently installed on your computer, click Yes to install it. 0.239173348 23.91733% 0.332047157 -0.252118427 -25.21184% -0.262979599 0.063595944 6.35959% 0.121156627 -0.358983814 -35.89838% -0.203374309 0.437330709 0.832267891 83.22679% -17.18347% -27.37102% -0.080290176 -0.303246871 det 0.46103683 52.62868% -0.171834663 -0.273710155 0.526286823 ZOZOVOU -0.279412326 0.223344288 2011 -0.330442789 990 -0.339723935 Sample Regression for MLHR using a 2% Risk free rate Market Risk premium vs Equity Returns -27.94123% -0.222531243 50.0% 0.377620039 -0.429359027 22.33443% 2010 -33.04428% 100 -33.97239% 53.52234% -0.078800008 40.0% -0.064914372 0.535223426 2120 -0.331736073 -33.17361% 0.21725638 300% 1.462615156 146.26152% 0.163153267 cos -0.030481685 -0.061401496 -6.14015% 20.0% 3.27977% 0.778852421 . . 0.032797731 - -0.207697494 . -20.76975% -0.2538417 . y = 1.1222x -0.0004 R = 0.2891 100% -0.004604216 -0.46042% -0.150330697 . . -0.196185075 -0.067819122 -19.61851% -13.99125% -0.139912483 -0.066654832 -20.0% - 15,0% -10.0% 10.0% 15.0% 0.0% . 10.0% -0.205272663 -20.52727% -0.230809264 . 0.472531923 47.25319% 0.406583713 . 0.157579403 15.75794% 0.241904215 2008 0.256002233 25.60022% -0.115671439 0.034071984 3.40720% 0.191104031 -300% 0.026600874 2.66009% -0.1738092 -17.38092% -40.0% 0.474588999 47.45890% * -32.86239% -0.328623884 0.053737671 -0.258802012 0.029202852 so Weet 0.566470045 2004014 -0.383184145 C001 0.046172997 0.751874142 -0.335318335 -0.023201615 -0.036826404 5.37377% -3.68264% -19.35287% -0.193528708 0.407532477 40.75325% -0.079109031 -7.91090% 0.02103736 -0.186343817 -18.63438% -0.074986567 -0.121473255 -12.14733% -0.156305895 20.17382% 0.050429435 0.20173816 -0.247211364 -24.72114% -0.290389225 0.508447834 50.84478% 0.536219358 -0.078103801 -7.81038% -0.081150125 -0.368990451 -36.89905% -0.120228835 Question 2: Explanation of Statistical Calculations Using the Calculating Statistic spreadsheet and your text book write the formulas and describe the calculations for the following cells: Cell 168 is shown as an example for the answers expected 168 What is the Expected Monthly Return (E(R)) for the company and its value? C66/60, where C66 is the sum of monthly returns, therefore this is the average monthly return for company Value = 0.020296 169 a. What is the Variance for the company and its value? (0.4 points) Value = 170 b. What is the Standard Deviation for the company and its Value? (0.4 points) Value = F68 c. What is the Expected Return (E(R)) for the market index and its Value? (0.4 points) Value = F69 d. What is the Variance for the market index and its Value? (0.4 points) Value = F70 e. What is the Standard Deviation for the market index and its Value? (0.4 points) Value = Question 4: Regression Statistics Regression Instructions Select Data and then Data Analysis Tab from top options of Excel. (See instructions on Regression tab if Data Analysis option is missing). Select Regression. Input the Company Returns (collumn C of 6.Regression spreadsheet for Y variable) Input the Market Risk Premium (collumn B of 6.Regression spreadsheet for X var.) Select OK and Regression Output should be created on a new worksheet. Generate the Regression output and answer the following questions NOTE: There is an Example of MLHR Regression Output on Tab below. IMPORTANT: Input the Risk-Free rate below BEFORE you run regressions. Otherwise the intercept value will be incorrect. Go to the following website and input the latest available 5-year Daily Treasury Yield Curve Rate below https://www.treasury.gov/resource-center/data-chart-center/interest-rates/Pages/TextView.aspx?data=yield 5-Year Rf 1% (0.5 Points) a. What is the value of the Y-Intercept for the Regression Y-Intercept (0.5 points) b. What is the value of the measure of how well the regression model estimates company returns? Fit-Measure (0.5 points) c. How well does this regression model fit the data? (0.5 Points) d. Input the regression coefficients from the regression output, to generate the regression equation. Slope (0.5 points) Y-Intercept Equation ly=x+ Note: we are basically trying to plot the CAPM equation: Re =Rf+B(Rm - Rf). So your intercept will -- the monthly risk free rate. This spreadsheet calculates the Expected Returns, Variances, and Standard Deviations of 2 Return Series. Page down to bottom for results Distance Market Company from Mean Variance(M) Variance(C) Date Returns Returns (Ry - E(R)) (Ry - E(R) (RC-E(R.)) (R-ER.) Jun-21 -0.79305 -0.75253 -0.83959 0.70492 -0.77283 0.59726 May-21 0.04437 -0.09419 -0.00217 0.00000 -0.11448 0.01311 Apr-21 -0.39126 -0.28701 -0.43780 0.19167 -0.30730 0.09443 Mar-21 0.83645 0.44527 0.78990 0.62394 0.42497 0.18060 Feb-21 -0.06736 -0.18141 -0.11391 0.01298 -0.20171 0.04069 Jan-21 0.04293 -0.03528 -0.00361 0.00001 -0.05558 0.00309 Dec-20 -0.12422 0.09378 -0.17076 0.02916 0.07349 0.00540 Nov-20 -0.05756 -0.26656 -0.10411 0.01084 -0.28685 0.08228 Oct-20 -0.10233 -0.25496 -0.14888 0.02216 -0.27526 0.07577 Sep-20 0.73563 -0.04541 0.68908 0.47484 -0.06570 0.00432 Aug-20 -0.30534 0.34758 -0.35189 0.12382 0.32728 0.10711 Jul-20 -0.36187 -0.06878 -0.40841 0.16680 -0.08908 0.00794 Jun-20 0.23461 0.15590 0.18806 0.03537 0.13560 0.01839 May-20 -0.32237 -0.14068 -0.36891 0.13610 -0.16098 0.02591 Apr-20 -0.52425 -0.48005 -0.57080 0.32581 -0.50035 0.25035 Mar-20 1.80825 1.07999 1.76171 3.10361 1.05969 1.12295 Feb-20 0.51595 0.02894 0.46941 0.22034 0.00864 0.00007 Jan-20 0.08312 0.22839 0.03658 0.00134 0.20809 0.04330 Dec-19 0.23917 0.33205 0.19263 0.03710 0.31175 0.09719 Nov-19 -0.25212 -0.26298 -0.29867 0.08920 -0.28328 0.08025 Oct-19 0.06360 0.12116 0.01705 0.00029 0.10086 0.01017 Sep-19 -0.35898 -0.20337 -0.40553 0.16446 -0.22367 0.05003 Aug-19 0.83227 0.43733 0.78572 0.61736 0.41703 0.17392 Jul-19 -0.17183 -0.08029 -0.21838 0.04769 -0.10059 0.01012 Jun-19 -0.27371 -0.30325 -0.32026 0.10256 -0.32354 0.10468 May-19 0.52629 0.46104 0.47974 0.23015 0.44074 0.19425 Apr-19 -0.27941 -0.22253 -0.32596 0.10625 -0.24283 0.05897 Mar-19 0.22334 0.37762 0.17680 0.03126 0.35732 0.12768 Feb-19 -0.33044 -0.42936 -0.37699 0.14212 -0.44966 0.20219 Jan-19 -0.33972 -0.07880 -0.38627 0.14921 -0.09910 0.00982 Dec-18 0.53522 -0.06491 0.48868 0.23880 -0.08521 0.00726 Nov-18 -0.33174 0.21726 -0.37828 0.14310 0.19696 0.03879 Oct-18 1.46262 0.16315 1.41607 2.00525 0.14286 0.02041 Sep-18 -0.06140 -0.03048 -0.10795 0.01165 -0.05078 0.00258 Aug-18 0.03280 0.77885 -0.01375 0.00019 0.75856 0.57541 Jul-18 -0.20770 -0.25384 -0.25424 0.06464 -0.27414 0.07515 Jun-18 -0.00460 -0.15033 -0.05115 0.00262 -0.17063 0.02911 May-18 -0.19619 -0.06782 -0.24273 0.05892 -0.08812 0.00776 Apr-18 -0.13991 -0.06665 -0.18646 0.03477 0.00756 Mar-18 -0.20527 -0.23081 -0.25182 0.06341 -0.25111 0.06305 Feb-18 0.47253 0.40658 0.42599 0.18146 0.38629 0.14922 Jan-18 0.15758 0.24190 0.11103 0.01233 0.22161 0.04911 Dec-17 0.25600 -0.11567 0.20946 0.04387 -0.13597 0.01849 Nov-17 0.03407 0.19110 -0.01247 0.00016 0.17081 0.02918 Oct-17 0.02660 -0.25880 -0.01995 0.00040 -0.27910 0.07790 Sep-17 -0.17381 0.02920 -0.22036 0.04856 0.00891 0.00008 Aug-17 0.47459 0.56647 0.42804 0.18322 0.54617 0.29831 Jul-17 -0.32862 -0.38318 -0.37517 0.14075 -0.40348 0.16280 Jun-17 0.05374 0.04617 0.00719 0.00005 0.02588 0.00067 May-17 -0.03683 0.75187 -0.08337 0.00695 0.73158 0.53521 Apr-17 -0.19353 -0.33532 -0.24008 0.05764 -0.35561 0.12646 Mar-17 0.40753 -0.02320 0.36099 0.13031 -0.04350 0.00189 Feb-17 -0.07911 0.02104 -0.12566 0.01579 0.00074 0.00000 Jan-17 -0.18634 -0.07499 -0.23289 0.05424 -0.09528 0.00908 Dec-16 -0.12147 -0.15631 -0.16802 0.02823 -0.17660 0.03119 Nov-16 0.20174 0.05043 0.15519 0.02408 0.03013 0.00091 Oct-16 -0.24721 -0.29039 -0.29376 0.08629 -0.31069 0.09653 Sep-16 0.50845 0.53622 0.46190 0.21335 0.51592 0.26618 Aug-16 -0.07810 -0.08115 -0.12465 0.01554 -0.10145 0.01029 Jul-16 -0.36899 -0.12023 -0.41554 0.17267 -0.14052 0.01975 Sums: 2.79281 1.21777 11.94061 6.50254 Market Company E(R): 0.04655 0.02030 Variance: 0.19901 0.10838 Standard Deviation: 0.44611 0.32920 -0.08695 Month# Date SPY Date AAPL Mkt Returns Co. Returns 1 2021/6/1 315995800 2021/6/1 423603500 -79.304778% -75.253087% 2 2021/5/1 1.527E+09 2021/5/1 1711742800 4.437275% -9.418715% 3 2021/4/1 1.462E+09 2021/4/1 1889731200 -39.125687% -28.700641% 4 2021/3/1 2.402E+09 2021/3/1 2650418200 83.644626% 44.527094% 5 2021/2/1 1. 308E+09 2021/2/1 1833855600 -6.736186% -18.141021% 6 2021/1/1 1.402E+09 2021/1/1 2240262000 4.293203% -3.528032% 7 2020/12/1 1. 345E+09 2020/12/1 2322189600 -12.421658% 9.378476% 8 2020/11/1 1.535E+09 2020/11/1 2123077300 -5.756346% -26.655547% 9 2020/10/1 1.629E+09 2020/10/1 2894666500 -10.232837% -25.495910% 10 2020/9/1 1.815E+09 2020/9/1 3885245100 73.563160% -4.540865% 11 2020/8/1 1.046E+09 2020/8/1 4070061100 -30.534062% 34.757598% 12 2020/7/1 1. 505E+09 2020/7/1 3020283200 -36.186816% -6.878402% 13 2020/6/1 2. 359E+09 2020/6/1 3243375600 23.461045% 15.589792% 14 2020/5/1 1.91E+09 2020/5/1 2805936000 -32.236649% -14.068028% 15 2020/4/1 2. 819E+09 2020/4/1 3265299200 -52.424841% -48.005389% 16 2020/3/1 5. 926E+09 2020/3/1 6280072400 180.825313% 107.999061% 17 2020/2/1 2. 11E+09 2020/2/1 3019279200 51.595484% 2.893595% 18 2020/1/1 1. 392E+09 2020/1/1 2934370400 8.312326% 22.838948% 19 2019/12/1 1.285E+09 2019/12/1 2388794800 23.917335% 33.204716% 20 2019/11/1 1.037E+09 2019/11/1 1793326000 -25.211843% -26.297960% 21 2019/10/1 1.387E+09 2019/10/1 2433210800 6.359594% 12.115663% 22 2019/9/1 1.304E+09 2019/9/1 2170268400 -35.898381% -20.337431% 23 2019/8/1 2. 034E+09 2019/8/1 2724326400 83.226789% 43.733071% 24 2019/7/1 1.11E+09 2019/7/1 1895406800 -17.183466% -8.029018% 25 2019/6/1 1.34E+09 2019/6/1 2060874800 -27.371015% -30.324687% 26 2019/5/1 1. 846E+09 2019/5/1 2957826400 52.628682% 46.103683% 27 2019/4/1 1. 209E+09 2019/4/1 2024470800 -27.941233% -22.253124% 28 2019/3/1 1.678E+09 2019/3/1 2603925600 22.334429% 37.762004% 29 2019/2/1 1.372E+09 2019/2/1 1890162400 -33.044279% 42.935903% 30 2019/1/1 2. 049E+09 2019/1/1 3312349600 -33.972393% -7.880001% 31 2018/12/1 3. 103E+09 2018/12/1 3595690000 53.522343% -6.491437% 32 2018/11/1 2.021E+09 2018/11/1 3845305600 -33.173607% 21.725638% 33 2018/10/1 3.024E+09 2018/10/1 3158994000 146.261516% 16.315327% 34 2018/9/1 1.228E+09 2018/9/1 2715888000 -6.140150% -3.048168% 35 2018/8/1 1. 308E+09 2018/8/1 2801275600 3.279773% 77.885242% 36 2018/7/1 1.267E+09 2018/7/1 1574765600 -20.769749% -25.384170% 37 2018/6/1 1.599E+09 2018/6/1 2110498000 -0.460422% -15.033070% 38 2018/5/1 1. 606E+09 2018/5/1 2483905200 -19.618507% -6.781912% 39 2018/4/1 1.998E+09 2018/4/1 2664617200 -13.991248% -6.665483% 40 2018/3/1 2. 324E+09 2018/3/1 2854910800 -20.527266% -23.080926% 41 2018/2/1 2.924E+09 2018/2/1 3711577200 47.253192% 40.658371% 42 2018/1/1 1.986E+09 2018/1/1 2638717600 15.757940% 24.190421% 43 2017/12/1 1.715E+09 2017/12/1 2124735200 25.600223% -11.567144% 44 2017/11/1 1.366E+09 2017/11/1 2402653600 3.407198% 19.110403% 45 2017/10/1 1.321E+09 2017/10/1 2017165200 2.660087% -25.880291% 46 2017/9/1 1.286E+09 2017/9/1 2721496400 -17.380920% 2.920285% 47 2017/8/1 1.557E+09 2017/8/1 2644276000 47.458900% 56.647005% 48 2017/7/1 1.056E+09 2017/7/1 1688047600 -32.862388% -38.318414% 49 2017/6/1 1.573E+09 2017/6/1 2736712400 5.373767% 4.617300% 50 2017/5/1 1.493E+09 2017/5/1 2615927200 -3.682640% 75.187414% 51 2017/4/1 1.55E+09 2017/4/1 1493216400 -19.352871% -33.531834% 52 2017/3/1 1.921E+09 2017/3/1 2246513600 40.753248% -2.320161% 53 2017/2/1 1.365E+09 2017/2/1 2299874400 -7.910903% 2.103736% 54 2017/1/1 1. 482E+09 2017/1/1 2252488000 -18.634382% -7.498657% 55 2016/12/1 1. 822E+09 2016/12/1 2435086800 -12.147325% -15.630589% 56 2016/11/1 2. 074E+09 2016/11/1 2886220000 20.173816% 5.042943% 57 2016/10/1 1. 726E+09 2016/10/1 2747657200 -24.721136% -29.038923% 58 2016/9/1 2. 292E+09 2016/9/1 3872062400 50.844783% 53.621936% 59 2016/8/1 1.52E+09 2016/8/1 2520514000 -7.810380% -8.115012% 60 2016/7/1 1.648E+09 2016/7/1 2743118400 -36.899045% -12.022883% 61 2016/6/1 2. 612E+09 2016/6/1 3117990800 from Mean from Mean (RA-E(R)) Covariance(MC) (Ry - E(RX)X(RC-E(R)) 0.64886 -0.83959 -0.00217 (RC-E(R)) -0.77283 -0.11448 -0.30730 0.42497 -0.43780 0.78990 Market Company Date Returns Returns Jun-21 -0.79305 -0.75253 May-21 0.04437 -0.09419 Apr-21 -0.39126 -0.28701 Mar-21 0.83645 0.44527 Feb-21 -0.06736 -0.18141 Jan-21 0.04293 -0.03528 Dec-20 -0.12422 0.09378 Nov-20 -0.05756 -0.26656 Oct-20 -0.10233 -0.25496 Sep-20 0.73563 -0.04541 Aug-20 -0.30534 0.34758 0.00025 0.13454 0.33569 0.02298 0.00020 -0.11391 -0.20171 -0.00361 -0.17076 -0.05558 0.07349 -0.28685 -0.01255 -0.10411 0.02986 -0.14888 -0.27526 0.04098 0.68908 -0.06570 -0.04528 0.32728 -0.11517 Jul-20 -0.36187 -0.06878 -0.08908 0.03638 -0.35189 -0.40841 0.18806 -0.36891 Jun-20 0.23461 May-20 -0.32237 Apr-20 -0.52425 Mar-20 1.80825 0.02550 0.05939 0.15590 -0.14068 -0.48005 1.07999 0.13560 -0.16098 -0.50035 -0.57080 0.28560 1.76171 1.05969 Feb-20 0.51595 0.02894 0.46941 0.00864 0.22839 0.03658 0.19263 0.20809 0.31175 1.86687 0.00406 0.00761 0.06005 0.08460 0.00172 0.09071 -0.29867 0.33205 -0.26298 0.12116 -0.20337 0.43733 -0.28328 0.01705 -0.40553 0.78572 0.10086 -0.22367 0.41703 0.32767 -0.08029 -0.21838 -0.10059 0.02197 Jan-20 0.08312 Dec-19 0.23917 Nov-19 -0.25212 Oct-19 0.06360 Sep-19 -0.35898 Aug-19 0.83227 Jul-19 -0.17183 Jun-19 -0.27371 May-19 0.52629 Apr-19 -0.27941 Mar-19 0.22334 Feb-19 -0.33044 Jan-19 -0.33972 Dec-18 0.53522 Nov-18 -0.33174 -0.32026 0.10362 0.21144 -0.30325 0.46104 -0.22253 0.37762 0.47974 -0.32596 0.17680 -0.32354 0.44074 -0.24283 0.35732 0.07915 0.06317 -0.42936 -0.37699 -0.44966 0.16952 -0.09910 0.03828 -0.07880 -0.06491 -0.04164 0.21726 -0.07451 -0.38627 0.48868 -0.37828 1.41607 -0.10795 -0.01375 Oct-18 1.46262 0.16315 0.20230 0.00548 -0.03048 Sep-18 -0.06140 Aug-18 0.03280 Jul-18 -0.20770 0.77885 -0.01043 -0.25384 -0.25424 0.06970 Jun-18 -0.00460 -0.15033 -0.05115 -0.08521 0.19696 0.14286 -0.05078 0.75856 -0.27414 -0.17063 -0.08812 -0.08695 -0.25111 0.38629 0.22161 -0.13597 0.00873 -0.06782 0.02139 0.01621 -0.06665 -0.2308 0.40658 0.24190 May-18 -0.19619 Apr-18 -0.13991 Mar-18 -0.20527 Feb-18 0.47253 Jan-18 0.15758 Dec-17 0.25600 Nov-17 0.03407 Oct-17 0.02660 Sep-17 -0.17381 Aug-17 0.47459 Jul-17 -0.32862 -0.24273 -0.18646 -0.25182 0.42599 0.11103 0.20946 -0.11567 0.19110 -0.01247 0.17081 -0.01995 -0.27910 -0.25880 0.02920 0.56647 0.00891 0.54617 0.06323 0.16455 0.02461 -0.02848 -0.00213 0.00557 -0.00196 0.23379 0.15137 0.00019 -0.06099 0.08537 -0.01570 -0.22036 0.42804 -0.37517 0.00719 -0.08337 -0.38318 -0.40348 Jun-17 0.05374 0.04617 0.02588 0.75187 0.73158 -0.24008 -0.35561 May-17 -0.03683 Apr-17 -0.19353 Mar-17 0.40753 Feb-17 -0.07911 -0.33532 -0.02320 -0.04350 0.02104 -0.00009 Jan-17 -0.18634 0.02219 Dec-16 -0.12147 Nov-16 0.20174 0.36099 -0.12566 -0.23289 -0.16802 0.15519 -0.29376 0.46190 -0.12465 -0.41554 0.02967 0.00468 0.00074 -0.09528 -0.17660 0.03013 -0.31069 0.51592 -0.10145 -0.14052 -0.07499 -0.15631 0.05043 -0.29039 0.53622 -0.08115 -0.12023 1.21777 Oct-16 -0.24721 0.09127 0.23831 0.01265 Sep-16 0.50845 Aug-16 -0.07810 Jul-16 -0.36899 Sums: 2.79281 0.05839 5.85136 Market & Company Company 0.02030 E(R): Variance and Covariance: Market 0.04655 0.19901 0.44611 0.10838 0.09752 Standard Deviation: 0.32920 Calculating Beta: Beta = Cov(CM)/Var(M)= 0.49 Note: Beta measures the comovement of the company returns with the market. 0.044372748 4.43727% -0.094187152 Monthly 5-year Risk-free rate -0.391256867 0 -0.287006405 0.445270936 0.836446256 -39.12569% 83.64463% -6.73619% 4.29320% -0.067361856 -0.18141021 0.042932033 -0.035280323 -0.124216582 -12.42166% 0.093784762 -0.057563458 -5.75635% -0.266555474 -0.102328374 -10.23284% -0.254959102 Regression Instructions Select Data and then Data Analysis Tab from top options of Excel. (See instructions on Regression tab if Data Analysis option i Select Regression Input the Company Returns (collumn C of 6.Regression spreadsheet for Y variable) Input the Market Risk Premium (collumn B of 6.Regression spreadsheet for X var.) Select OK and Regression Output should be created on a new worksheet. 0.735631597 73.56316% -0.045408655 -0.305340621 -30.53406% 0.347575982 -0.361868159 -36.18682% -0.068784016 0.234610451 23.46105% 0.155897925 -0.322366486 -32.23665% -0.140680278 -0.524248409 -52.42484% -0.480053892 1.808253131 180.82531% 1.079990615 0.515954842 51.59548% 0.028935952 0.228389479 0.083123258 8.31233% Instructions for adding Regression option on Excel 1. Click the Microsoft Office Button or the "File" Tab in the Menu Da and then click Excel Options. 2. Click Add-ins, and then in the Manage box, select Excel Add-ins. 3. Click Go. 4. In the Add-Ins available box, select the Analysis ToolPak check box, and then click OK. Tip If Analysis ToolPak is not listed in the Add-Ins available box, click Browse to locate it. If you are prompted that the Analysis ToolPak is not currently installed on your computer, click Yes to install it. 0.239173348 23.91733% 0.332047157 -0.252118427 -25.21184% -0.262979599 0.063595944 6.35959% 0.121156627 -0.358983814 -35.89838% -0.203374309 0.437330709 0.832267891 83.22679% -17.18347% -27.37102% -0.080290176 -0.303246871 det 0.46103683 52.62868% -0.171834663 -0.273710155 0.526286823 ZOZOVOU -0.279412326 0.223344288 2011 -0.330442789 990 -0.339723935 Sample Regression for MLHR using a 2% Risk free rate Market Risk premium vs Equity Returns -27.94123% -0.222531243 50.0% 0.377620039 -0.429359027 22.33443% 2010 -33.04428% 100 -33.97239% 53.52234% -0.078800008 40.0% -0.064914372 0.535223426 2120 -0.331736073 -33.17361% 0.21725638 300% 1.462615156 146.26152% 0.163153267 cos -0.030481685 -0.061401496 -6.14015% 20.0% 3.27977% 0.778852421 . . 0.032797731 - -0.207697494 . -20.76975% -0.2538417 . y = 1.1222x -0.0004 R = 0.2891 100% -0.004604216 -0.46042% -0.150330697 . . -0.196185075 -0.067819122 -19.61851% -13.99125% -0.139912483 -0.066654832 -20.0% - 15,0% -10.0% 10.0% 15.0% 0.0% . 10.0% -0.205272663 -20.52727% -0.230809264 . 0.472531923 47.25319% 0.406583713 . 0.157579403 15.75794% 0.241904215 2008 0.256002233 25.60022% -0.115671439 0.034071984 3.40720% 0.191104031 -300% 0.026600874 2.66009% -0.1738092 -17.38092% -40.0% 0.474588999 47.45890% * -32.86239% -0.328623884 0.053737671 -0.258802012 0.029202852 so Weet 0.566470045 2004014 -0.383184145 C001 0.046172997 0.751874142 -0.335318335 -0.023201615 -0.036826404 5.37377% -3.68264% -19.35287% -0.193528708 0.407532477 40.75325% -0.079109031 -7.91090% 0.02103736 -0.186343817 -18.63438% -0.074986567 -0.121473255 -12.14733% -0.156305895 20.17382% 0.050429435 0.20173816 -0.247211364 -24.72114% -0.290389225 0.508447834 50.84478% 0.536219358 -0.078103801 -7.81038% -0.081150125 -0.368990451 -36.89905% -0.120228835
Step by Step Solution
There are 3 Steps involved in it

Get step-by-step solutions from verified subject matter experts