

Question: Question 2 Given the following data to test for dependence, show process for determining the first entry in the expected matrix. Use specific values and
Question 2
Given the following data to test for dependence, show process for determining the first entry in the expected matrix. Use specific values and do not provide the answer.
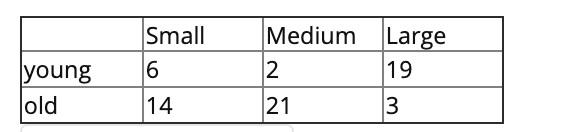
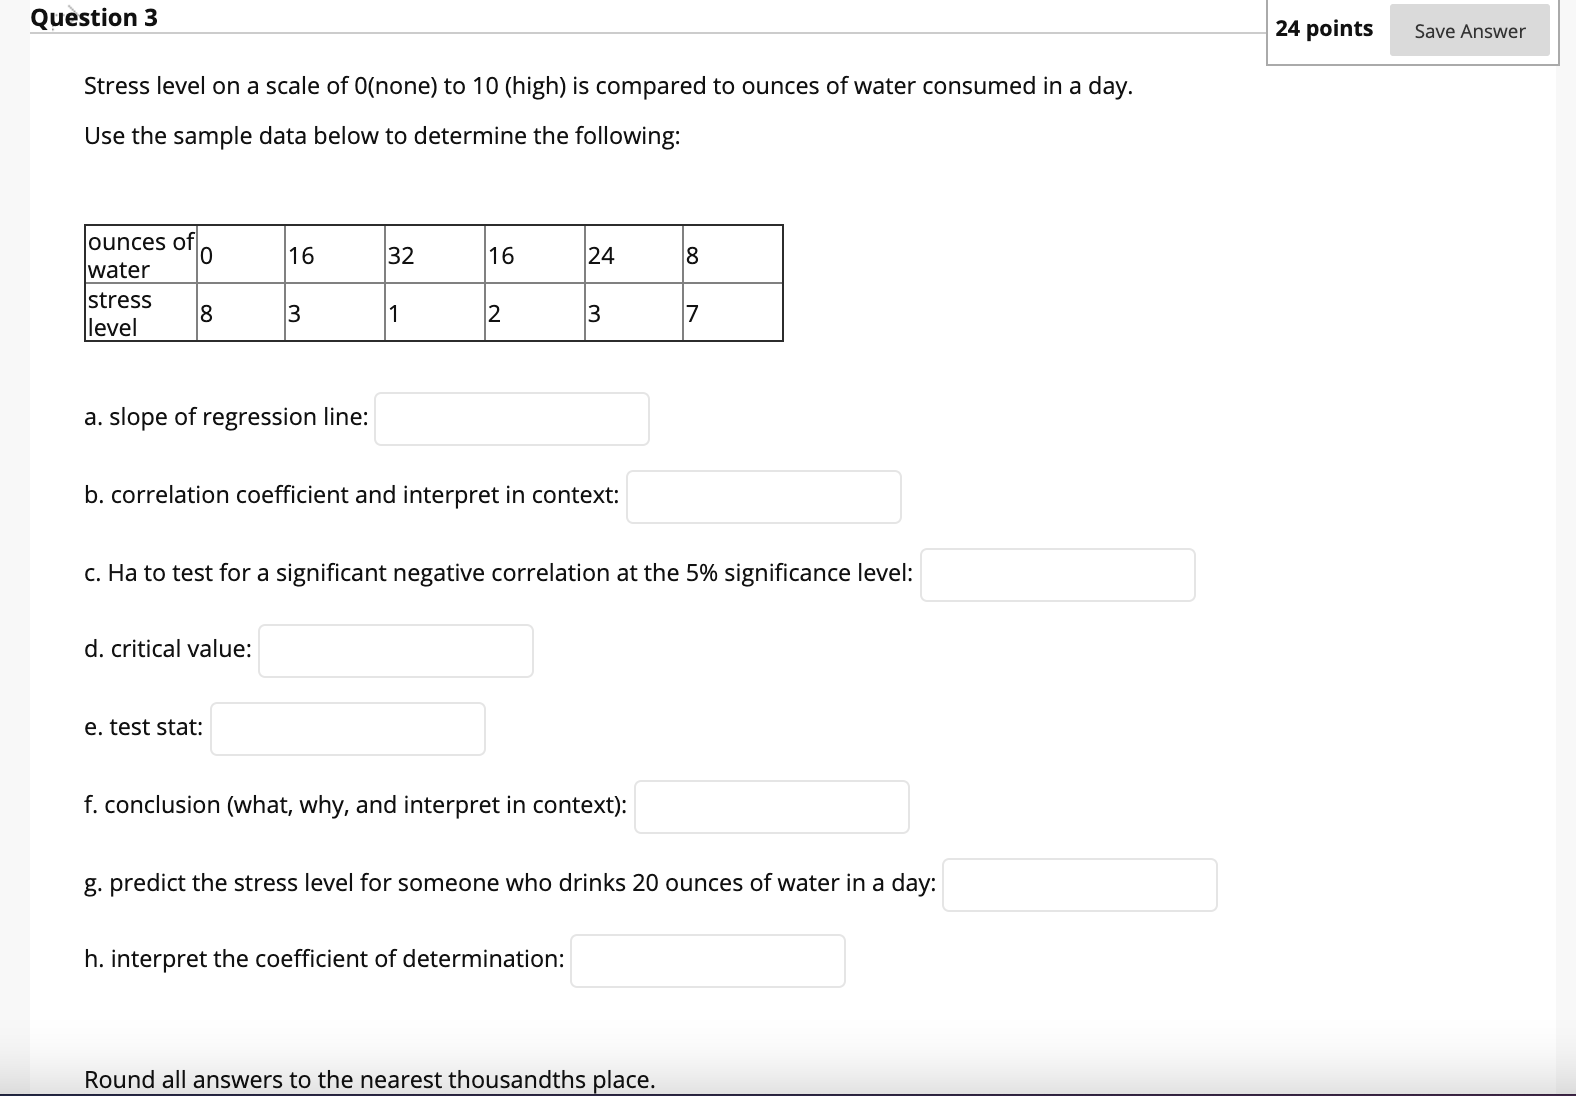
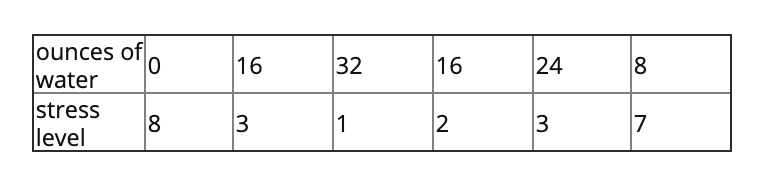
Small Medium Large young 6 2 19 old 14 21 3Question 3 24 points Save Answer Stress level on a scale of 0(none) to 10 (high) is compared to ounces of water consumed in a day. Use the sample data below to determine the following: ounces of water stress level a. slope of regression line: b. correlation coefficient and interpret in context: c. Ha to test for a significant negative correlation at the 5% signicance level: d. critical value: e. test stat: f. conclusion (what, why, and interpret in context): g. predict the stress level for someone who drinks 20 ounces of water in a day: h. interpret the coefficient of determination: Round all answers to the nearest thousandths place. ounces of 0 16 water 32 16 24 8 stress level 8 3 2 3 7
Step by Step Solution
There are 3 Steps involved in it

Get step-by-step solutions from verified subject matter experts