

Question: Question 2 - Hourly Demand The Sheet named Hourly Demand contains data on the hourly demand for electrical power in Ontario for weekdays in the
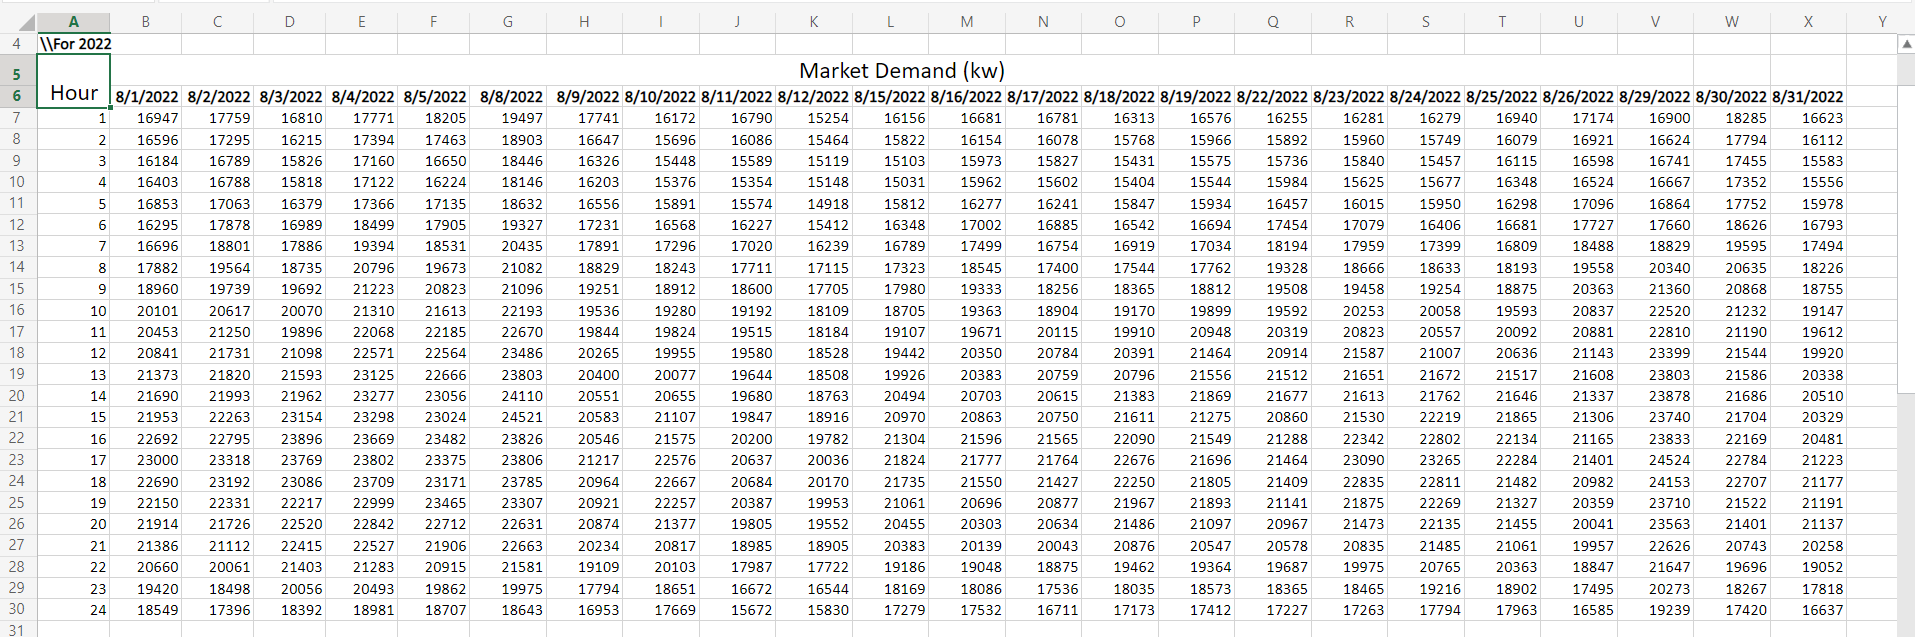
Question 2 - Hourly Demand The Sheet named Hourly Demand contains data on the hourly demand for electrical power in Ontario for weekdays in the month of August 2022. (Weekday demand is different from weekend demand, so different forecasts are required.) Plot the hourly demand for all of these 23 days. Your chart should have a line graph with 23 different coloured lines. A legend is not necessary for this graph. The y-axis should be labelled kilowatts and the x-axis should show the hours 1-24. (1 mark) Calculate a seasonality index for each hour. A separate trend analysis has determined that the overall average hourly demand for weekdays in August 2023 is expected to be 20,500 kilowatts, provide a forecast for the demand in each hour of a weekday in August 2023. (1 mark) Question 2 - Hourly Demand The Sheet named Hourly Demand contains data on the hourly demand for electrical power in Ontario for weekdays in the month of August 2022. (Weekday demand is different from weekend demand, so different forecasts are required.) Plot the hourly demand for all of these 23 days. Your chart should have a line graph with 23 different coloured lines. A legend is not necessary for this graph. The y-axis should be labelled kilowatts and the x-axis should show the hours 1-24. (1 mark) Calculate a seasonality index for each hour. A separate trend analysis has determined that the overall average hourly demand for weekdays in August 2023 is expected to be 20,500 kilowatts, provide a forecast for the demand in each hour of a weekday in August 2023. (1 mark)
Step by Step Solution
There are 3 Steps involved in it

Get step-by-step solutions from verified subject matter experts