

Question: Question 2. I need help with the RED answers only that are marked incorrect. Use the web address below for Appendix D. https://ezto-cf-media.mheducation.com/Media/Connect_Production/bne/doane_6e/chapter13/Appendix_D.jpg A regression
Question 2.
I need help with the RED answers only that are marked incorrect.
Use the web address below for Appendix D.
https://ezto-cf-media.mheducation.com/Media/Connect_Production/bne/doane_6e/chapter13/Appendix_D.jpg
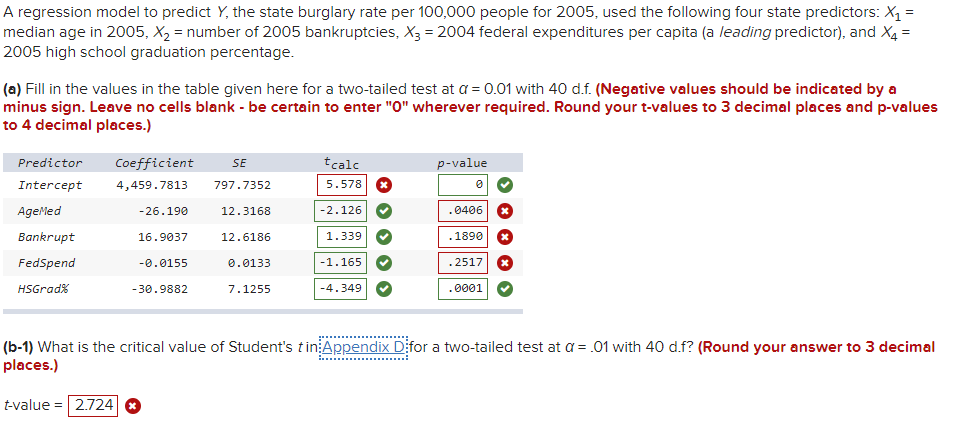
A regression model to predict Y, the state burglary rate per 100,000 people for 2005, used the following four state predictors: X1 = median age in 2005, X2 = number of 2005 bankruptcies, X3 = 2004 federal expenditures per capita [a leading predictor), and X4: 2005 high school graduation percentage. la] Fill in the values in the table given here for a huetailed test at a = 0.01 with 40 at {Negative values should be indicated by a minus sign. Leave no cells blank - be certain to enter \"0" wherever required. Round your tualues to 3 decimal places and p-ualues to 4 decimal places} Predictor Coefficient SE teal: pvalue Intercept 4,459.?313 T9?.?352 5.575 a B o AgeME-d -26.190 12.31.58 .8466 o Bankrupt 16 . 93 3? 12 . 6185 . 1390 o FedSpeno' o . 3155 a . 3133 .251? 0 156de 38.9352 7.1255 .9631 o place 5.} tvalue = O
Step by Step Solution
There are 3 Steps involved in it

Get step-by-step solutions from verified subject matter experts