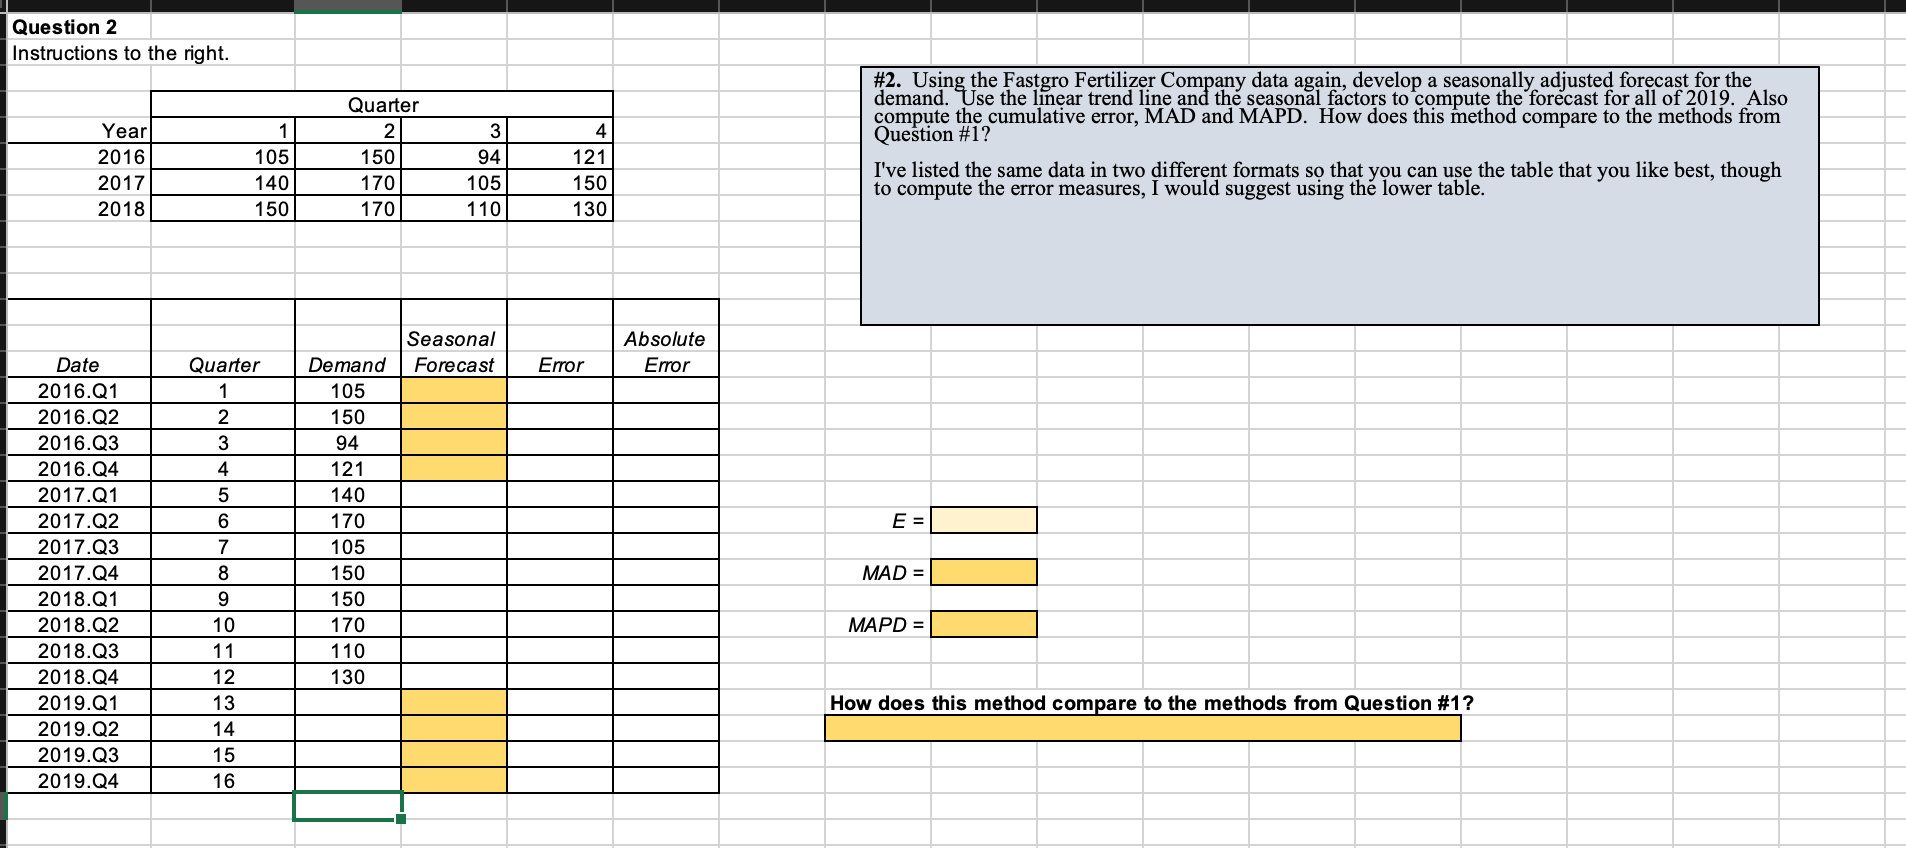
Question: Question 2 Instructions to the right. 1 Year 2016 2017 2018 Quarter 2 150 170 170 105 140 150 3 94 105 110 #2. Using

Question 2 Instructions to the right. 1 Year 2016

Question 2 Instructions to the right. 1 Year 2016 2017 2018 Quarter 2 150 170 170 105 140 150 3 94 105 110 #2. Using the Fastgro Fertilizer Company data again, develop a seasonally adjusted forecast for the demand. Use the linear trend line and the seasonal factors to compute the forecast for all of 2019. Also compute the cumulative error, MAD and MAPD. How does this method compare to the methods from Question #1? I've listed the same data in two different formats so that you can use the table that you like best, though to compute the error measures, I would suggest using the lower table. 4 121 150 130 Seasonal Forecast Absolute Error Quarter Error 1 2 3 4 5 6 Date 2016.01 2016.Q2 2016.03 2016.04 2017.01 2017.02 2017.03 2017.04 2018.01 2018.02 2018.03 2018.04 2019.Q1 2019.Q2 2019.Q3 2019.Q4 Demand 105 150 94 121 140 170 105 150 150 170 110 130 E = 8 MAD = 9 MAPD = 10 11 12 13 14 15 16 How does this method compare to the methods from Question #1

Step by Step Solution

There are 3 Steps involved in it

1 Expert Approved Answer
Step: 1 Unlock blur-text-image
Question Has Been Solved by an Expert!

Get step-by-step solutions from verified subject matter experts

Step: 2 Unlock
Step: 3 Unlock

Students Have Also Explored These Related General Management Questions!