

Question: Please solve for the highlighted cells and show your formulas! Question 2 Instructions to the right. 1 4 Year 2016 2017 2018 105 140 150
Please solve for the highlighted cells and show your formulas!
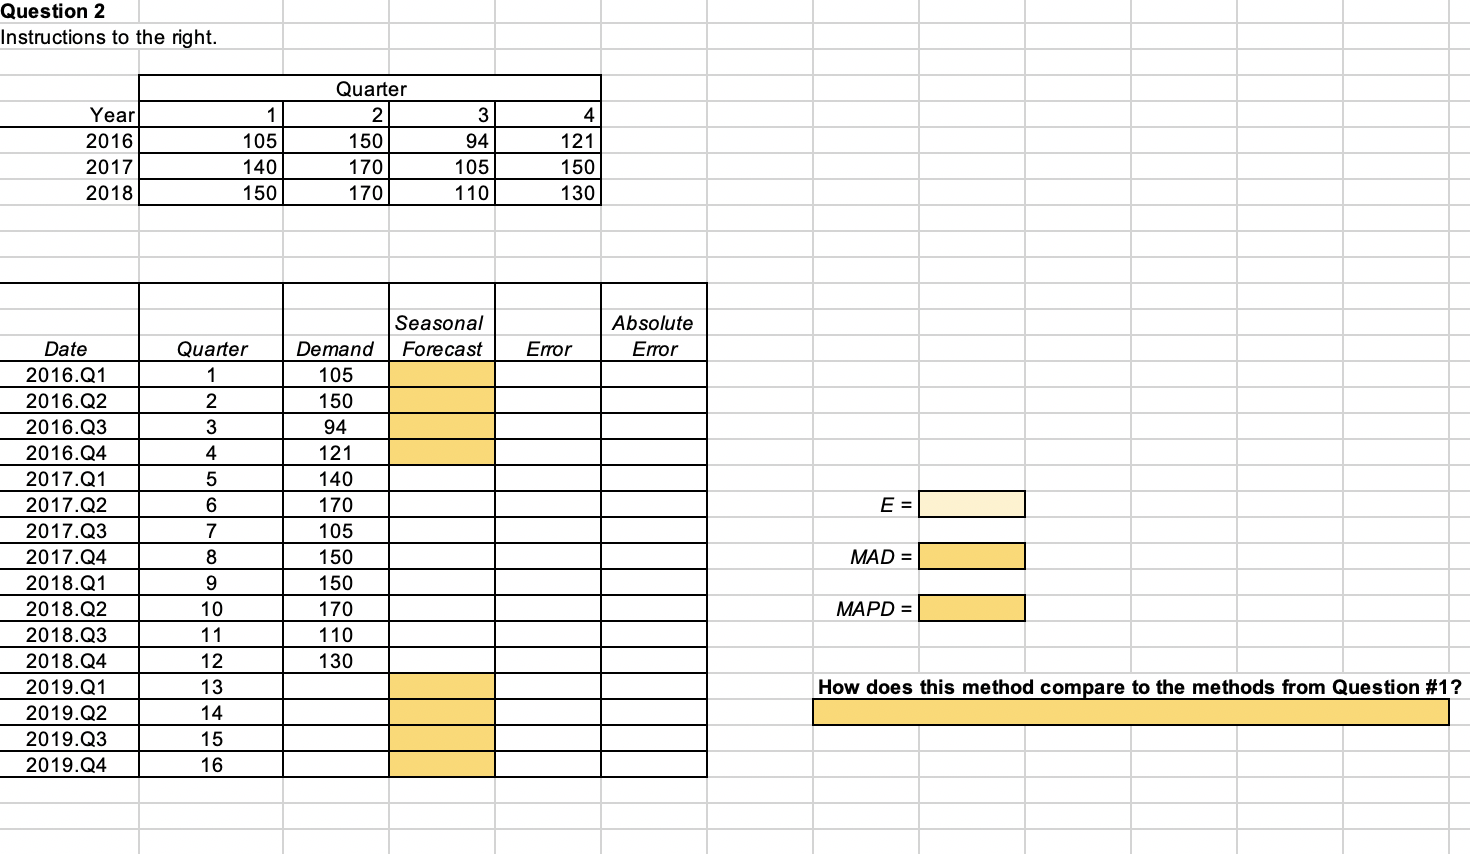
Question 2 Instructions to the right. 1 4 Year 2016 2017 2018 105 140 150 Quarter 2 150 170 170 3 94 105 110 121 150 130 Seasonal Forecast Absolute Error Quarter Error 1 2 3 4 5 Date 2016.01 2016.Q2 2016.03 2016.04 2017.01 2017.02 2017.Q3 2017.04 2018.01 2018.02 2018.Q3 2018.04 2019.01 2019.Q2 2019.Q3 2019.04 E = Demand 105 150 94 121 140 170 105 150 150 170 110 130 6 7 8 MAD = 9 MAPD = 10 11 12 13 14 15 16 How does this method compare to the methods from Question #1? Question 2 Instructions to the right. 1 4 Year 2016 2017 2018 105 140 150 Quarter 2 150 170 170 3 94 105 110 121 150 130 Seasonal Forecast Absolute Error Quarter Error 1 2 3 4 5 Date 2016.01 2016.Q2 2016.03 2016.04 2017.01 2017.02 2017.Q3 2017.04 2018.01 2018.02 2018.Q3 2018.04 2019.01 2019.Q2 2019.Q3 2019.04 E = Demand 105 150 94 121 140 170 105 150 150 170 110 130 6 7 8 MAD = 9 MAPD = 10 11 12 13 14 15 16 How does this method compare to the methods from Question #1
Step by Step Solution
There are 3 Steps involved in it
1 Expert Approved Answer
Step: 1 Unlock

Question Has Been Solved by an Expert!
Get step-by-step solutions from verified subject matter experts
Step: 2 Unlock
Step: 3 Unlock