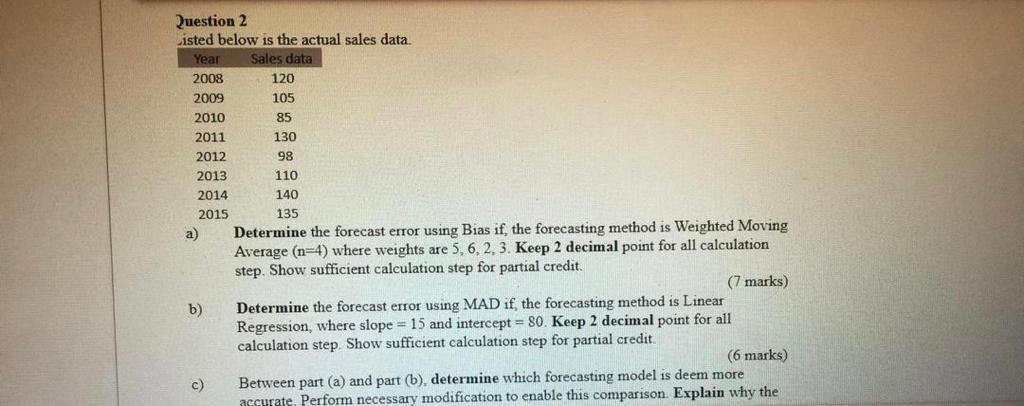
Question: Question 2 Listed below is the actual sales data. Year Sales data 2008 120 2009 105 2010 85 2011 130 2012 98 2013 110 2014

Question 2 Listed below is the actual sales data.Question 2 Listed below is the actual sales data.

Question 2 Listed below is the actual sales data. Year Sales data 2008 120 2009 105 2010 85 2011 130 2012 98 2013 110 2014 140 2015 135 a) Determine the forecast error using Bias if, the forecasting method is Weighted Moving Average (n=4) where weights are 5, 6.2.3. Keep 2 decimal point for all calculation step. Show sufficient calculation step for partial credit. (7 marks) b) Determine the forecast error using MAD if the forecasting method is Linear Regression, where slope = 15 and intercept = 80. Keep 2 decimal point for all calculation step. Show sufficient calculation step for partial credit. (6 marks) c) Between part (a) and part (b), determine which forecasting model is deem more accurate. Perform necessary modification to enable this comparison Explain why the c) (6 marks) Between part (a) and part (b), determine which forecasting model is deem more accurate. Perform necessary modification to enable this comparison. Explain why the model you have identified is deem more accurate. (6 marks) "Accurate forecasting could help reduction of Supply Chain Cost by enabling the Supply Chain to be more Efficient". Provide an example to justify this statement. (6 marks) d)

Step by Step Solution

There are 3 Steps involved in it

1 Expert Approved Answer
Step: 1 Unlock blur-text-image
Question Has Been Solved by an Expert!

Get step-by-step solutions from verified subject matter experts

Step: 2 Unlock
Step: 3 Unlock

Students Have Also Explored These Related General Management Questions!