

Question: Question 2: Match up Presented on the next page are common-size condensed balance sheets and income statements for 8 rms in different industries. These common-size
Question 2: Match up
Presented on the next page are common-size condensed balance sheets and income statements for 8 rms in different industries. These common-size balance sheets and income statements express various items as a percentage of operating revenues. (That is, the statement divides all amounts by operating revenues for the year.) Additionally, the last line shows the ratio of cash ow from operations to capital expenditures for each firm.
Each of the columns corresponds to one of the firms described below:
Firm
Firm A: Pharmaceutical company that develops and manufactures drugs.
Firm B: Leading consumer products company selling items such as toothpaste, laundry detergent and cosmetics. Grew through acquisition of competitors.
Firm C: Electronics retailer.
Firm D: Utility providing electricity and natural gas.
Firm E: Insurance company providing home and automobile insurance products nationwide.
Firm F: Highly profitable software company that provides database management software.
Firm G: Fast food restaurant chain.
Firm H: Finance company that specializes in personal loans.
Required
- Place the number of each column with the correct company named above.
- Explain your reasoning to support your work.
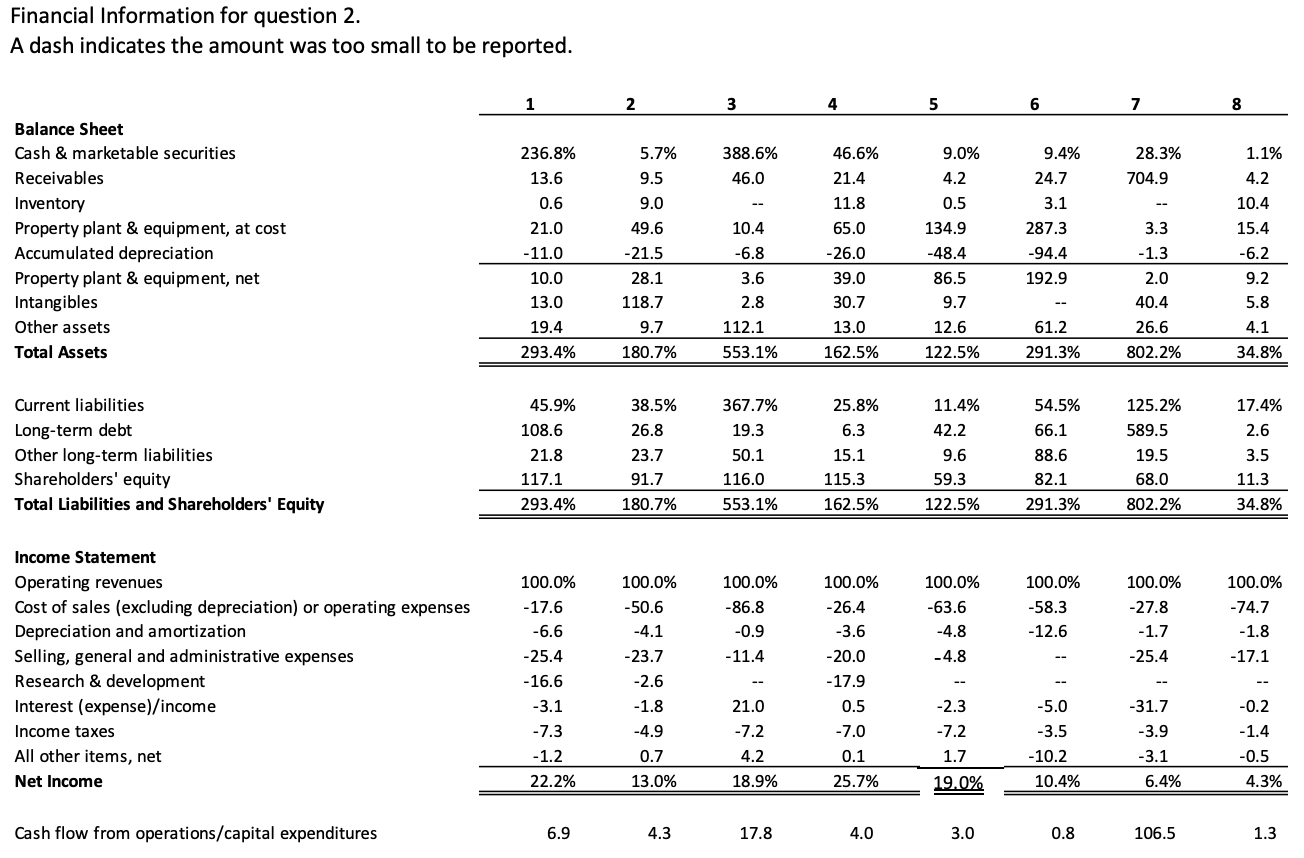
Financial Information for question 2. A dash indicates the amount was too small to be reported. 1 2 3 4 5 6 7 8 236.8% 13.6 388.6% 46.0 9.4% 24.7 28.3% 704.9 0.6 3.1 287.3 21.0 Balance Sheet Cash & marketable securities Receivables Inventory Property plant & equipment, at cost Accumulated depreciation Property plant & equipment, net Intangibles Other assets Total Assets 5.7% 9.5 9.0 49.6 -21.5 28.1 118.7 9.7 180.7% - 11.0 46.6% 21.4 11.8 65.0 -26.0 39.0 30.7 13.0 162.5% 3.3 -1.3 9.0% 4.2 0.5 134.9 -48.4 86.5 9.7 12.6 122.5% 1.1% 4.2 10.4 15.4 -6.2 9.2 5.8 4.1 10.4 -6.8 3.6 2.8 112.1 553.1% -94.4 192.9 10.0 13.0 2.0 40.4 26.6 802.2% 19.4 61.2 291.3% 293.4% 34.8% 54.5% 66.1 Current liabilities Long-term debt Other long-term liabilities Shareholders' equity Total Liabilities and Shareholders' Equity 45.9% 108.6 21.8 117.1 293.4% 38.5% 26.8 23.7 91.7 180.7% 367.7% 19.3 50.1 116.0 553.1% 25.8% 6.3 15.1 115.3 162.5% 11.4% 42.2 9.6 59.3 122.5% 88.6 82.1 291.3% 125.2% 589.5 19.5 68.0 802.2% 17.4% 2.6 3.5 11.3 34.8% 100.0% -17.6 -6.6 100.0% -86.8 -0.9 - 11.4 100.0% -50.6 -4.1 -23.7 -2.6 -1.8 100.0% -58.3 -12.6 100.0% -63.6 -4.8 -4.8 Income Statement Operating revenues Cost of sales (excluding depreciation) or operating expenses Depreciation and amortization Selling, general and administrative expenses Research & development Interest (expense)/income Income taxes All other items, net Net Income 100.0% -26.4 -3.6 -20.0 -17.9 0.5 -7.0 100.0% -27.8 -1.7 -25.4 100.0% -74.7 -1.8 -17.1 -25.4 - 16.6 -3.1 -7.3 -31.7 -3.9 21.0 -7.2 4.2 18.9% -4.9 0.7 13.0% -2.3 -7.2 1.7 19.0% -5.0 -3.5 - 10.2 10.4% -0.2 -1.4 -0.5 4.3% -1.2 22.2% 0.1 25.7% -3.1 6.4% Cash flow from operations/capital expenditures 6.9 4.3 17.8 4.0 3.0 0.8 106.5 1.3 Financial Information for question 2. A dash indicates the amount was too small to be reported. 1 2 3 4 5 6 7 8 236.8% 13.6 388.6% 46.0 9.4% 24.7 28.3% 704.9 0.6 3.1 287.3 21.0 Balance Sheet Cash & marketable securities Receivables Inventory Property plant & equipment, at cost Accumulated depreciation Property plant & equipment, net Intangibles Other assets Total Assets 5.7% 9.5 9.0 49.6 -21.5 28.1 118.7 9.7 180.7% - 11.0 46.6% 21.4 11.8 65.0 -26.0 39.0 30.7 13.0 162.5% 3.3 -1.3 9.0% 4.2 0.5 134.9 -48.4 86.5 9.7 12.6 122.5% 1.1% 4.2 10.4 15.4 -6.2 9.2 5.8 4.1 10.4 -6.8 3.6 2.8 112.1 553.1% -94.4 192.9 10.0 13.0 2.0 40.4 26.6 802.2% 19.4 61.2 291.3% 293.4% 34.8% 54.5% 66.1 Current liabilities Long-term debt Other long-term liabilities Shareholders' equity Total Liabilities and Shareholders' Equity 45.9% 108.6 21.8 117.1 293.4% 38.5% 26.8 23.7 91.7 180.7% 367.7% 19.3 50.1 116.0 553.1% 25.8% 6.3 15.1 115.3 162.5% 11.4% 42.2 9.6 59.3 122.5% 88.6 82.1 291.3% 125.2% 589.5 19.5 68.0 802.2% 17.4% 2.6 3.5 11.3 34.8% 100.0% -17.6 -6.6 100.0% -86.8 -0.9 - 11.4 100.0% -50.6 -4.1 -23.7 -2.6 -1.8 100.0% -58.3 -12.6 100.0% -63.6 -4.8 -4.8 Income Statement Operating revenues Cost of sales (excluding depreciation) or operating expenses Depreciation and amortization Selling, general and administrative expenses Research & development Interest (expense)/income Income taxes All other items, net Net Income 100.0% -26.4 -3.6 -20.0 -17.9 0.5 -7.0 100.0% -27.8 -1.7 -25.4 100.0% -74.7 -1.8 -17.1 -25.4 - 16.6 -3.1 -7.3 -31.7 -3.9 21.0 -7.2 4.2 18.9% -4.9 0.7 13.0% -2.3 -7.2 1.7 19.0% -5.0 -3.5 - 10.2 10.4% -0.2 -1.4 -0.5 4.3% -1.2 22.2% 0.1 25.7% -3.1 6.4% Cash flow from operations/capital expenditures 6.9 4.3 17.8 4.0 3.0 0.8 106.5 1.3
Step by Step Solution
There are 3 Steps involved in it

Get step-by-step solutions from verified subject matter experts