

Question: Question 2 MI. Hg is a trader in the commodity market. He has followed the corn price for a fest.r Fears and would like to
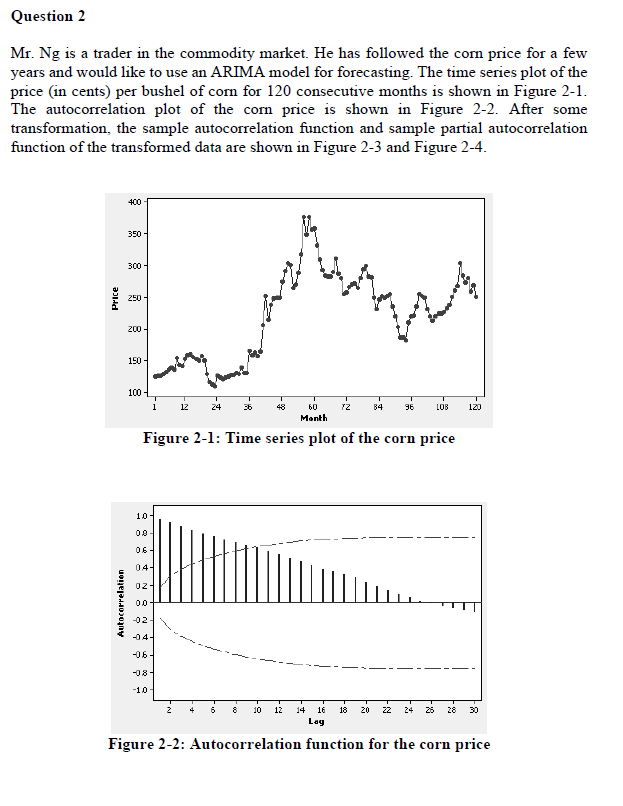
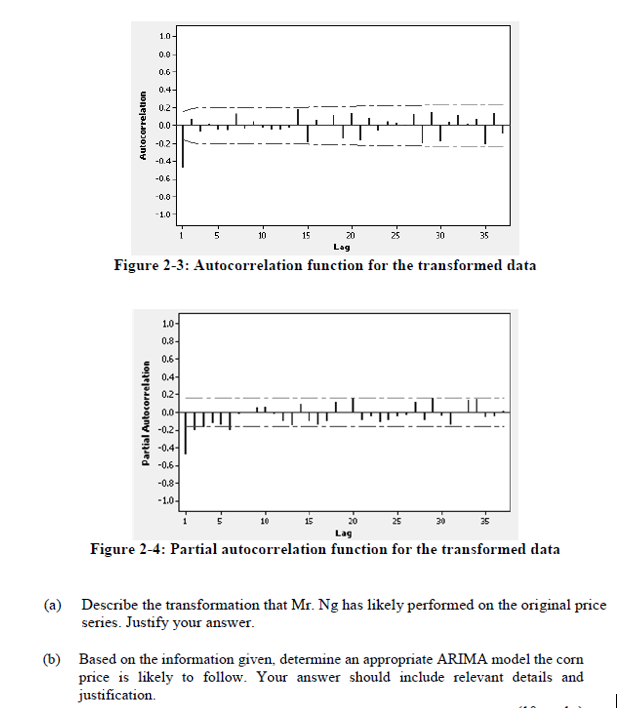
Question 2 MI. Hg is a trader in the commodity market. He has followed the corn price for a fest.r Fears and would like to use an ERMA model for forecasting. The time series plot of the price (in cents) per bushel of corn for 12'!) consecutive months is shown in Figure 21. The autocorrelation plot of the corn price is shown in Figure 22. After some transformation, the sample autocorrelation function and sample partial autocorrelation function of the transformed data are shown in Figure 23 and Figure 24. 35!) 30] 25B PI'IEE EIII 150 1|I| 1 12 24 I: 43 EU F2 B4 '36 [DB 13] Month Figure 11: Time series plot of the corn price Autnrnrrelali-n 24631012141618202224262330 Figure 22: Autororrela tion function for the corn price
Step by Step Solution
There are 3 Steps involved in it

Get step-by-step solutions from verified subject matter experts