

Question: Question 2 Paste dataset 2 into an appropriate dataset summarizer. Paste in inferential statistics that measure evidence for the claim there is a relationship between
Question 2
Paste dataset 2 into an appropriate dataset summarizer.
- Paste in inferential statistics that measure evidence for the claim there is a relationship between the variables "number of false positives?" and "costs per passenger?" if you consider the whole population
Also paste in the scatterplot
| Use this for question 2 of the assignment , also paste in the scatterplot | |||
| Inferential statistics | |||
| paste this into the word file and add comments | |||
| correlation r | 0.894478064 | ||
| R square | 0.800091008 | ||
| estimate of population slope | 1.888080659 | ||
| standard error of slope | 0.095335352 | ||
| Confidence interval | |||
| 95% of samples slopes are within | 1.984467455 | ||
| standard errors of the population slope | |||
| you can be 95% confident the population slope is between | |||
| 1.698890755 | |||
| and | |||
| 2.077270563 | |||
| 0 is not in the confidence interval so there is strong evidence of a relationship | |||
| Hypothesis testing | |||
| test stat of slope | 19.80462245 | ||
| two sided p-value for slope | 4.93577E-36 | ||
| To calculate the p-value H0:population slope =0 is assumed to be true | |||
| since the test is two sided H1 is H1:population slope ?0 |
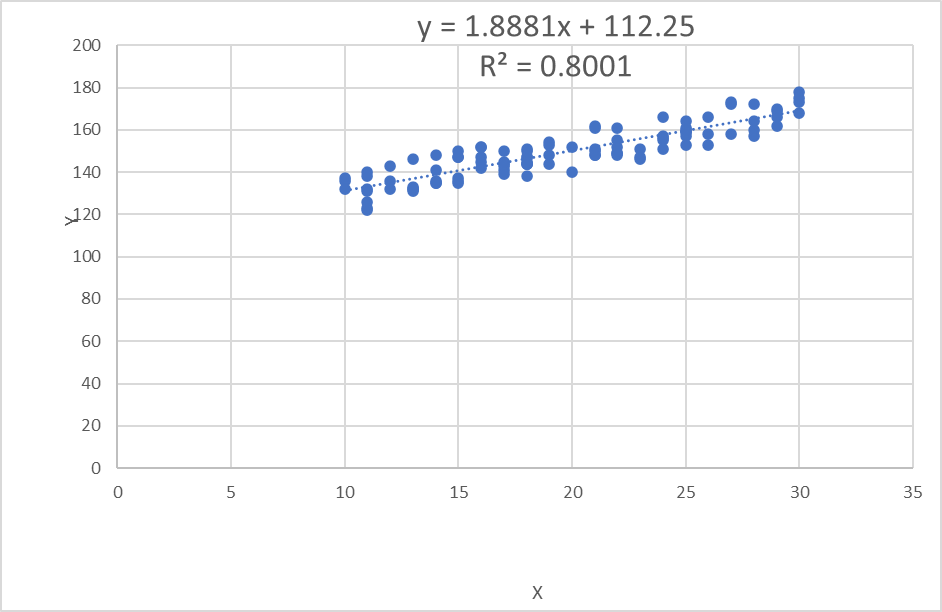
200 y = 1.8881x + 112.25 180 R2 = 0.8001 160 140 120 100 80 60 40 20 0 0 5 10 15 20 25 30 35 X
Step by Step Solution
There are 3 Steps involved in it
1 Expert Approved Answer
Step: 1 Unlock

Question Has Been Solved by an Expert!
Get step-by-step solutions from verified subject matter experts
Step: 2 Unlock
Step: 3 Unlock