

Question: Question 7 Paste dataset 2 into the dataset summarizer a) Paste in computer output that measure evidence for the claim there is a relationship between
Question 7
Paste dataset 2 into the dataset summarizer
a) Paste in computer output that measure evidence for the claim there is a relationship between the variables "preferred style ?" and "scared of Maths?" if you consider the whole population
Hint: inferential statistics measure evidence for a claim.
b) Make suitable comments about the output in part (a)
c) Go back to the dataset summarizer and scroll down , Paste in the output for question 7c given below the inferential statistics and fill in the blanks, you have to replace the blanks with numbers that give a smaller p-value than the p-value in question 7a , Note that the total of blanks must also agree with the existing total as well.
COUNTA of Scared of maths ? Scared of maths ?
Preferred style ? no yes Grand Total
direct 24 22 46
chatty 30 24 54
Grand Total 54 46 100
?
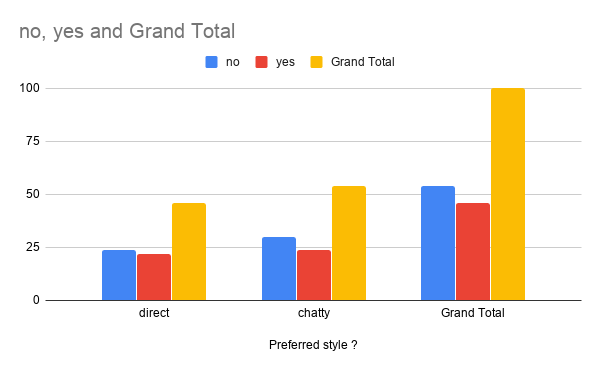
no, yes and Grand Total no yes Grand Total 100 75 50 25 0 direct chatty Grand Total Preferred style
Step by Step Solution
There are 3 Steps involved in it

Get step-by-step solutions from verified subject matter experts