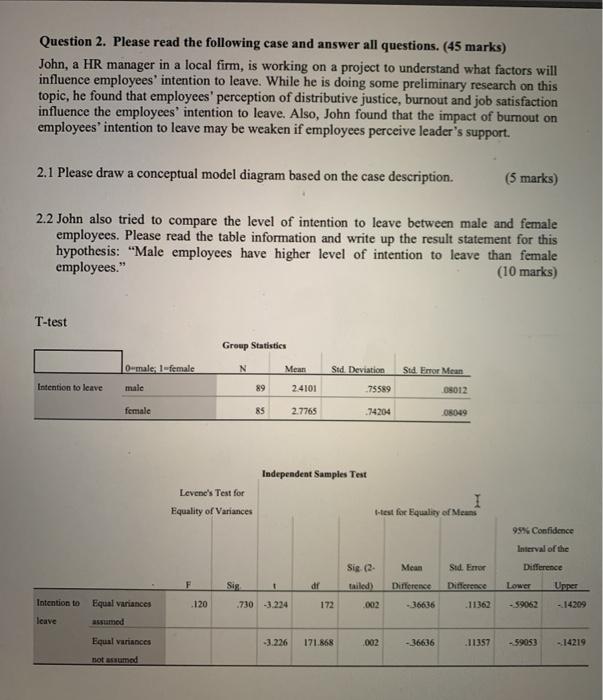
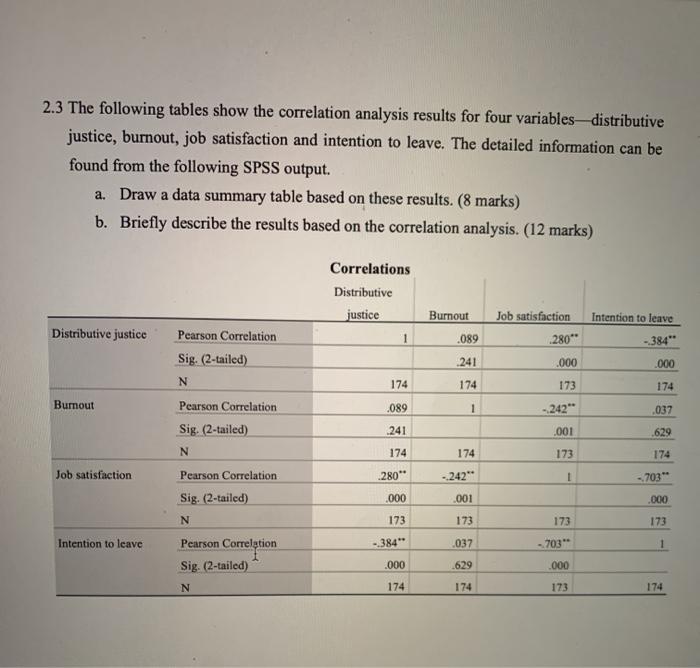
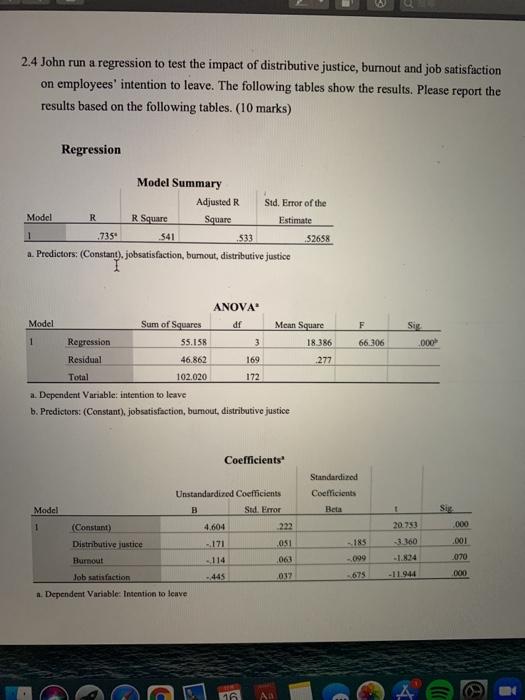
Question: Question 2. Please read the following case and answer all questions. (45 marks) John, a HR manager in a local firm, is working on a

Question 2. Please read the following case and
Question 2. Please read the following case and answer all questions. (45 marks) John, a HR manager in a local firm, is working on a project to understand what factors will influence employees' intention to leave. While he is doing some preliminary research on this topic, he found that employees' perception of distributive justice, burnout and job satisfaction influence the employees' intention to leave. Also, John found that the impact of burnout on employees' intention to leave may be weaken if employees perceive leader's support. 2.1 Please draw a conceptual model diagram based on the case description. (5 marks) 2.2 John also tried to compare the level of intention to leave between male and female employees. Please read the table information and write up the result statement for this hypothesis: "Male employees have higher level of intention to leave than female employees." (10 marks) T-test Group Statistics Oumale, 1-female N Mean Std Deviation Std. Error Mean Intention to leave male 89 2.4101 75589 08012 female 85 2.7765 74204 05049 Independent Samples Test Levene's Test for Equality of Variances 1 -test for Equality of Means 99% Confidence Interval of the Mean Sid. Emer Difference Sig (2 tailed) F Sig dr Difference Difference Lower Upper Intention to 120 .730 -3.234 172 002 -36636 14209 Equal variances assumed Icave Equal variances -3.226 171.868 002 - 36636 11357 - 59053 -14219 not assumed 2.3 The following tables show the correlation analysis results for four variables-distributive justice, burnout, job satisfaction and intention to leave. The detailed information can be found from the following SPSS output. a. Draw a data summary table based on these results. (8 marks) b. Briefly describe the results based on the correlation analysis. (12 marks) Correlations Distributive justice 1 Burnout Intention to leave Distributive justice .089 Job satisfaction 280* .000 Pearson Correlation Sig: (2-tailed) N - 384" 241 .000 174 174 173 174 Burnout ,089 1 -242" .037 Pearson Correlation Sig. (2-tailed) N 241 .001 629 174 174 173 174 Job satisfaction Pearson Correlation 280 -242" 1 703" .000 .001 .000 Sig: (2-tailed) N 173 173 173 173 Intention to leave - 384" 037 -703 Pearson Correlation Sig. (2-tailed) .000 .629 .000 N 174 174 173 174 2.4 John run a regression to test the impact of distributive justice, burnout and job satisfaction on employees' intention to leave. The following tables show the results. Please report the results based on the following tables. (10 marks) Regression Model Summary Adjusted R Sid. Error of the Model R Square Square Estimate 1 735 541 52658 a. Predictors: (Constant). jobsatisfaction, burnout, distributive justice R 533 F Sie 000 66.306 ANOVA Model Sum of Squares df Mean Square 1 Regression 55.158 3 18.386 Residual 46.862 169 277 Total 102.020 172 a. Dependent Variable: intention to leave b. Predictors: (Constant), jobsatisfaction, bumout, distributive justice Coefficients Standardized Coefficients Beta + Sig 20.753 Unstandardized Coefficients Model B Sud. Error 1 (Constant) 4.604 222 Distnbutive justice -171 051 Hurnout -114 063 Job satisfaction Dependent Variable: Intention to leave -185 -3360 .001 -099 070 017 -1 1.944 .000 16 A

Step by Step Solution

There are 3 Steps involved in it

1 Expert Approved Answer
Step: 1 Unlock blur-text-image
Question Has Been Solved by an Expert!

Get step-by-step solutions from verified subject matter experts

Step: 2 Unlock
Step: 3 Unlock

Students Have Also Explored These Related General Management Questions!