

Question: QUESTION 2 Table 1 and 2 below provide a summary of the performance indicators of three portfolios and the market, (25) respectively: fable 1: Residual
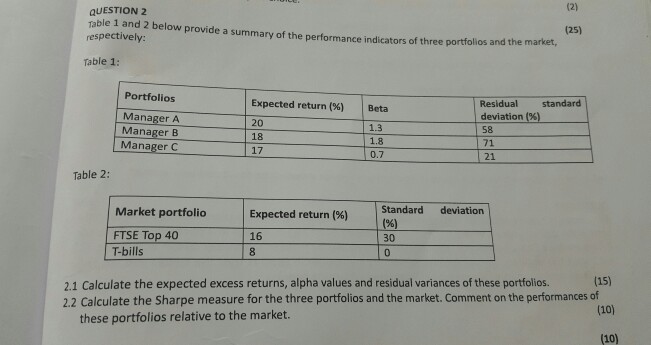
QUESTION 2 Table 1 and 2 below provide a summary of the performance indicators of three portfolios and the market, (25) respectively: fable 1: Residual standard deviation (94) | enianean t Portfolios Expected return (%) | Beta Manager A Manager B Manager C 20 18 17 1.3 1.8 0.7 58 71 21 Table 2: Standard deviation Market portfolio Expected return (%) 96) 30 16 FTSE Top 40 T-bills 2.1 Calculate the expected excess returns, alpha values and residual variances of these portfolios. 2.2 Calculate the Sharpe measure for the three portfolios and the market. Comment on the performances of (15) (10) (10) these portfolios relative to the market
Step by Step Solution
There are 3 Steps involved in it
1 Expert Approved Answer
Step: 1 Unlock

Question Has Been Solved by an Expert!
Get step-by-step solutions from verified subject matter experts
Step: 2 Unlock
Step: 3 Unlock