

Question: QUESTION 2 The data below represents the length in millimeters of 100 Dover sole taken randomly from catches obtained in Morro Bay, California. Length (mm)
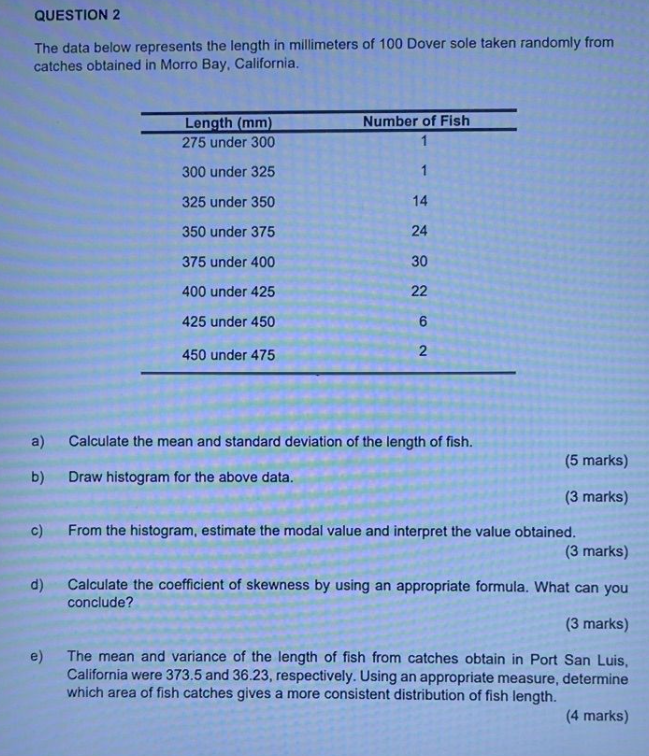
QUESTION 2 The data below represents the length in millimeters of 100 Dover sole taken randomly from catches obtained in Morro Bay, California. Length (mm) Number of Fish 275 under 300 300 under 325 325 under 350 14 350 under 375 24 375 under 400 30 400 under 425 22 425 under 450 6 N 450 under 475 a) Calculate the mean and standard deviation of the length of fish. (5 marks) b) Draw histogram for the above data. (3 marks) c) From the histogram, estimate the modal value and interpret the value obtained. (3 marks) d) Calculate the coefficient of skewness by using an appropriate formula. What can you conclude? (3 marks) e) The mean and variance of the length of fish from catches obtain in Port San Luis, California were 373.5 and 36.23, respectively. Using an appropriate measure, determine which area of fish catches gives a more consistent distribution of fish length. (4 marks)
Step by Step Solution
There are 3 Steps involved in it

Get step-by-step solutions from verified subject matter experts