

Question: Please include in the answer by creating the new and improved graph, am unable to create it. Thank you ing graph appeared in a local
Please include in the answer by creating the new and improved graph, am unable to create it. Thank you
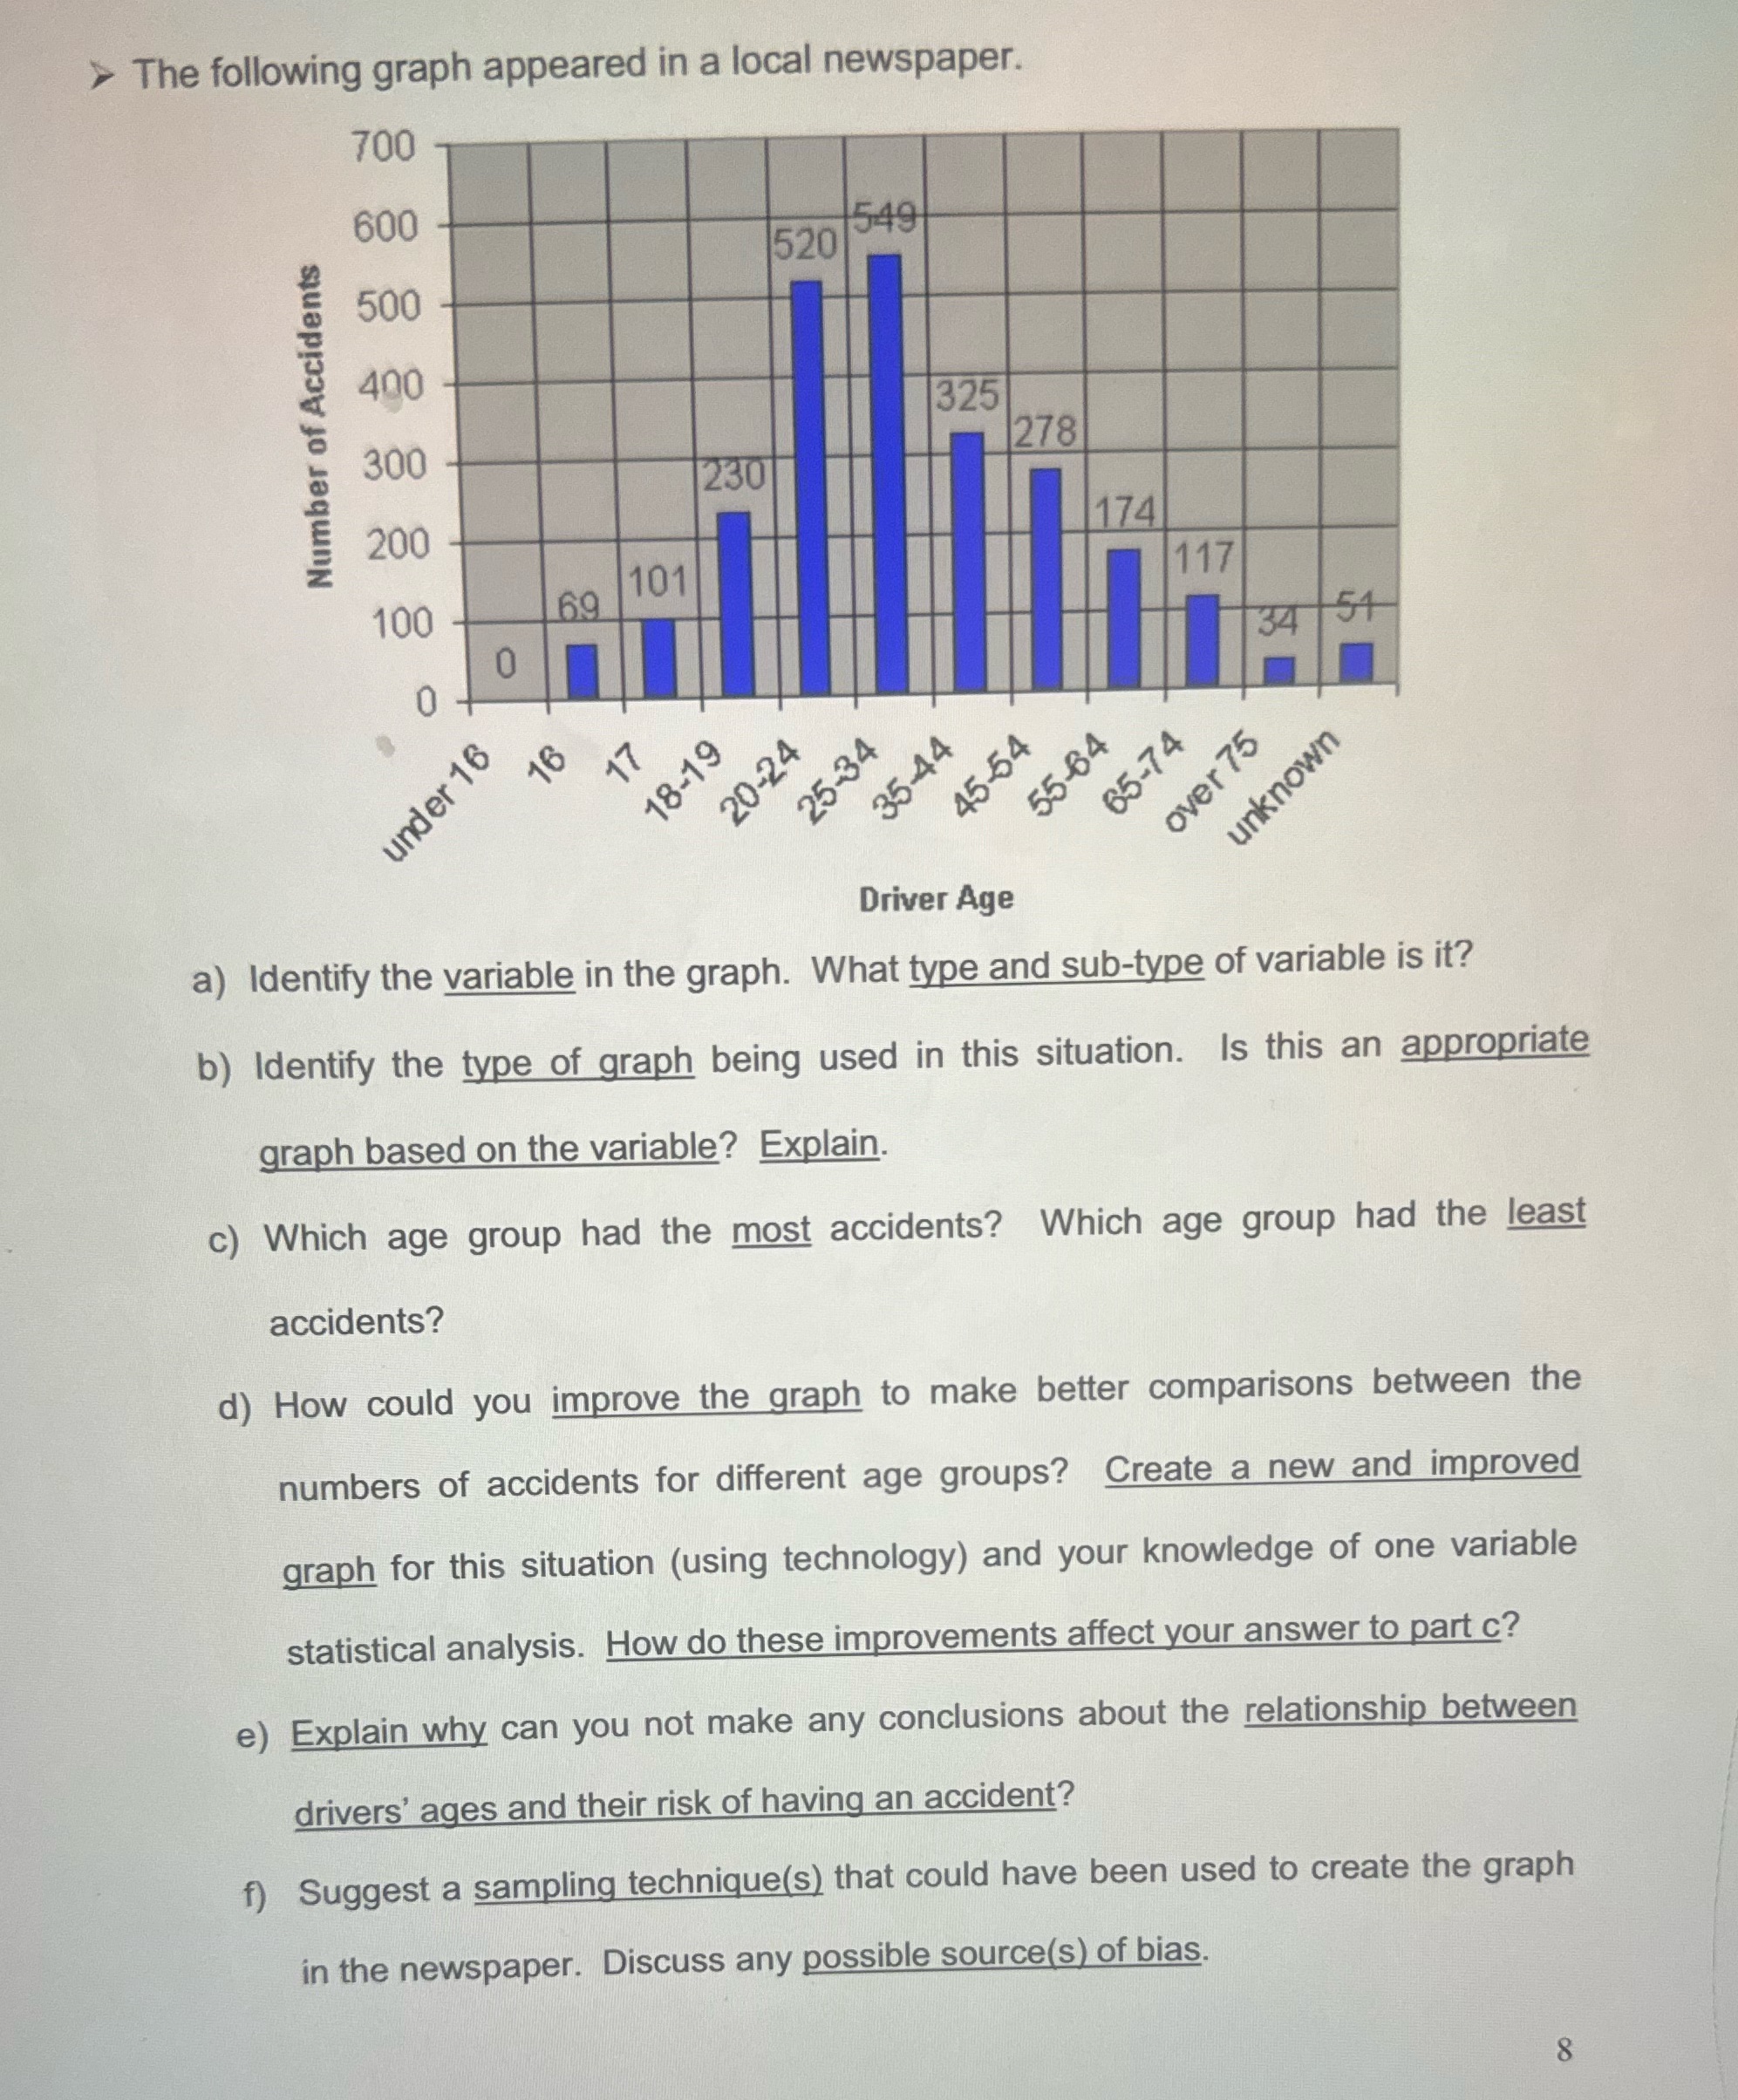
ing graph appeared in a local newspaper. 700 Number of Accidents 5 3 D g o> oF AF 4 @@@f o A O o> ok & &S ) Driver Age a) Identify the variable in the graph. What type and sub-type of variable is it? b) Identify the type of graph being used in this situation. Is this an appropriate graph based on the variable? Explain. - c) Which age group had the most accidents? Which age group had the least accidents? d) How could you improve the graph to make better comparisons between the numbers of accidents for different age groups? Create a new and improved graph for this situation (using technology) and your knowledge of one variable statistical analysis. How do these improvements affect your answer to part c? e) Explain why can you not make any conclusions about the relationship between drivers' ages and their risk of having an accident? f) Suggest a sampling technigue(s) that could have been used to create the graph in the newspaper. Discuss any possible source(s) of bias
Step by Step Solution
There are 3 Steps involved in it

Get step-by-step solutions from verified subject matter experts