

Question: Question 2 The data given to the right includes data from 41 Weights (g) of a Sample Bag of Candy candies, and 10 of them
Question 2
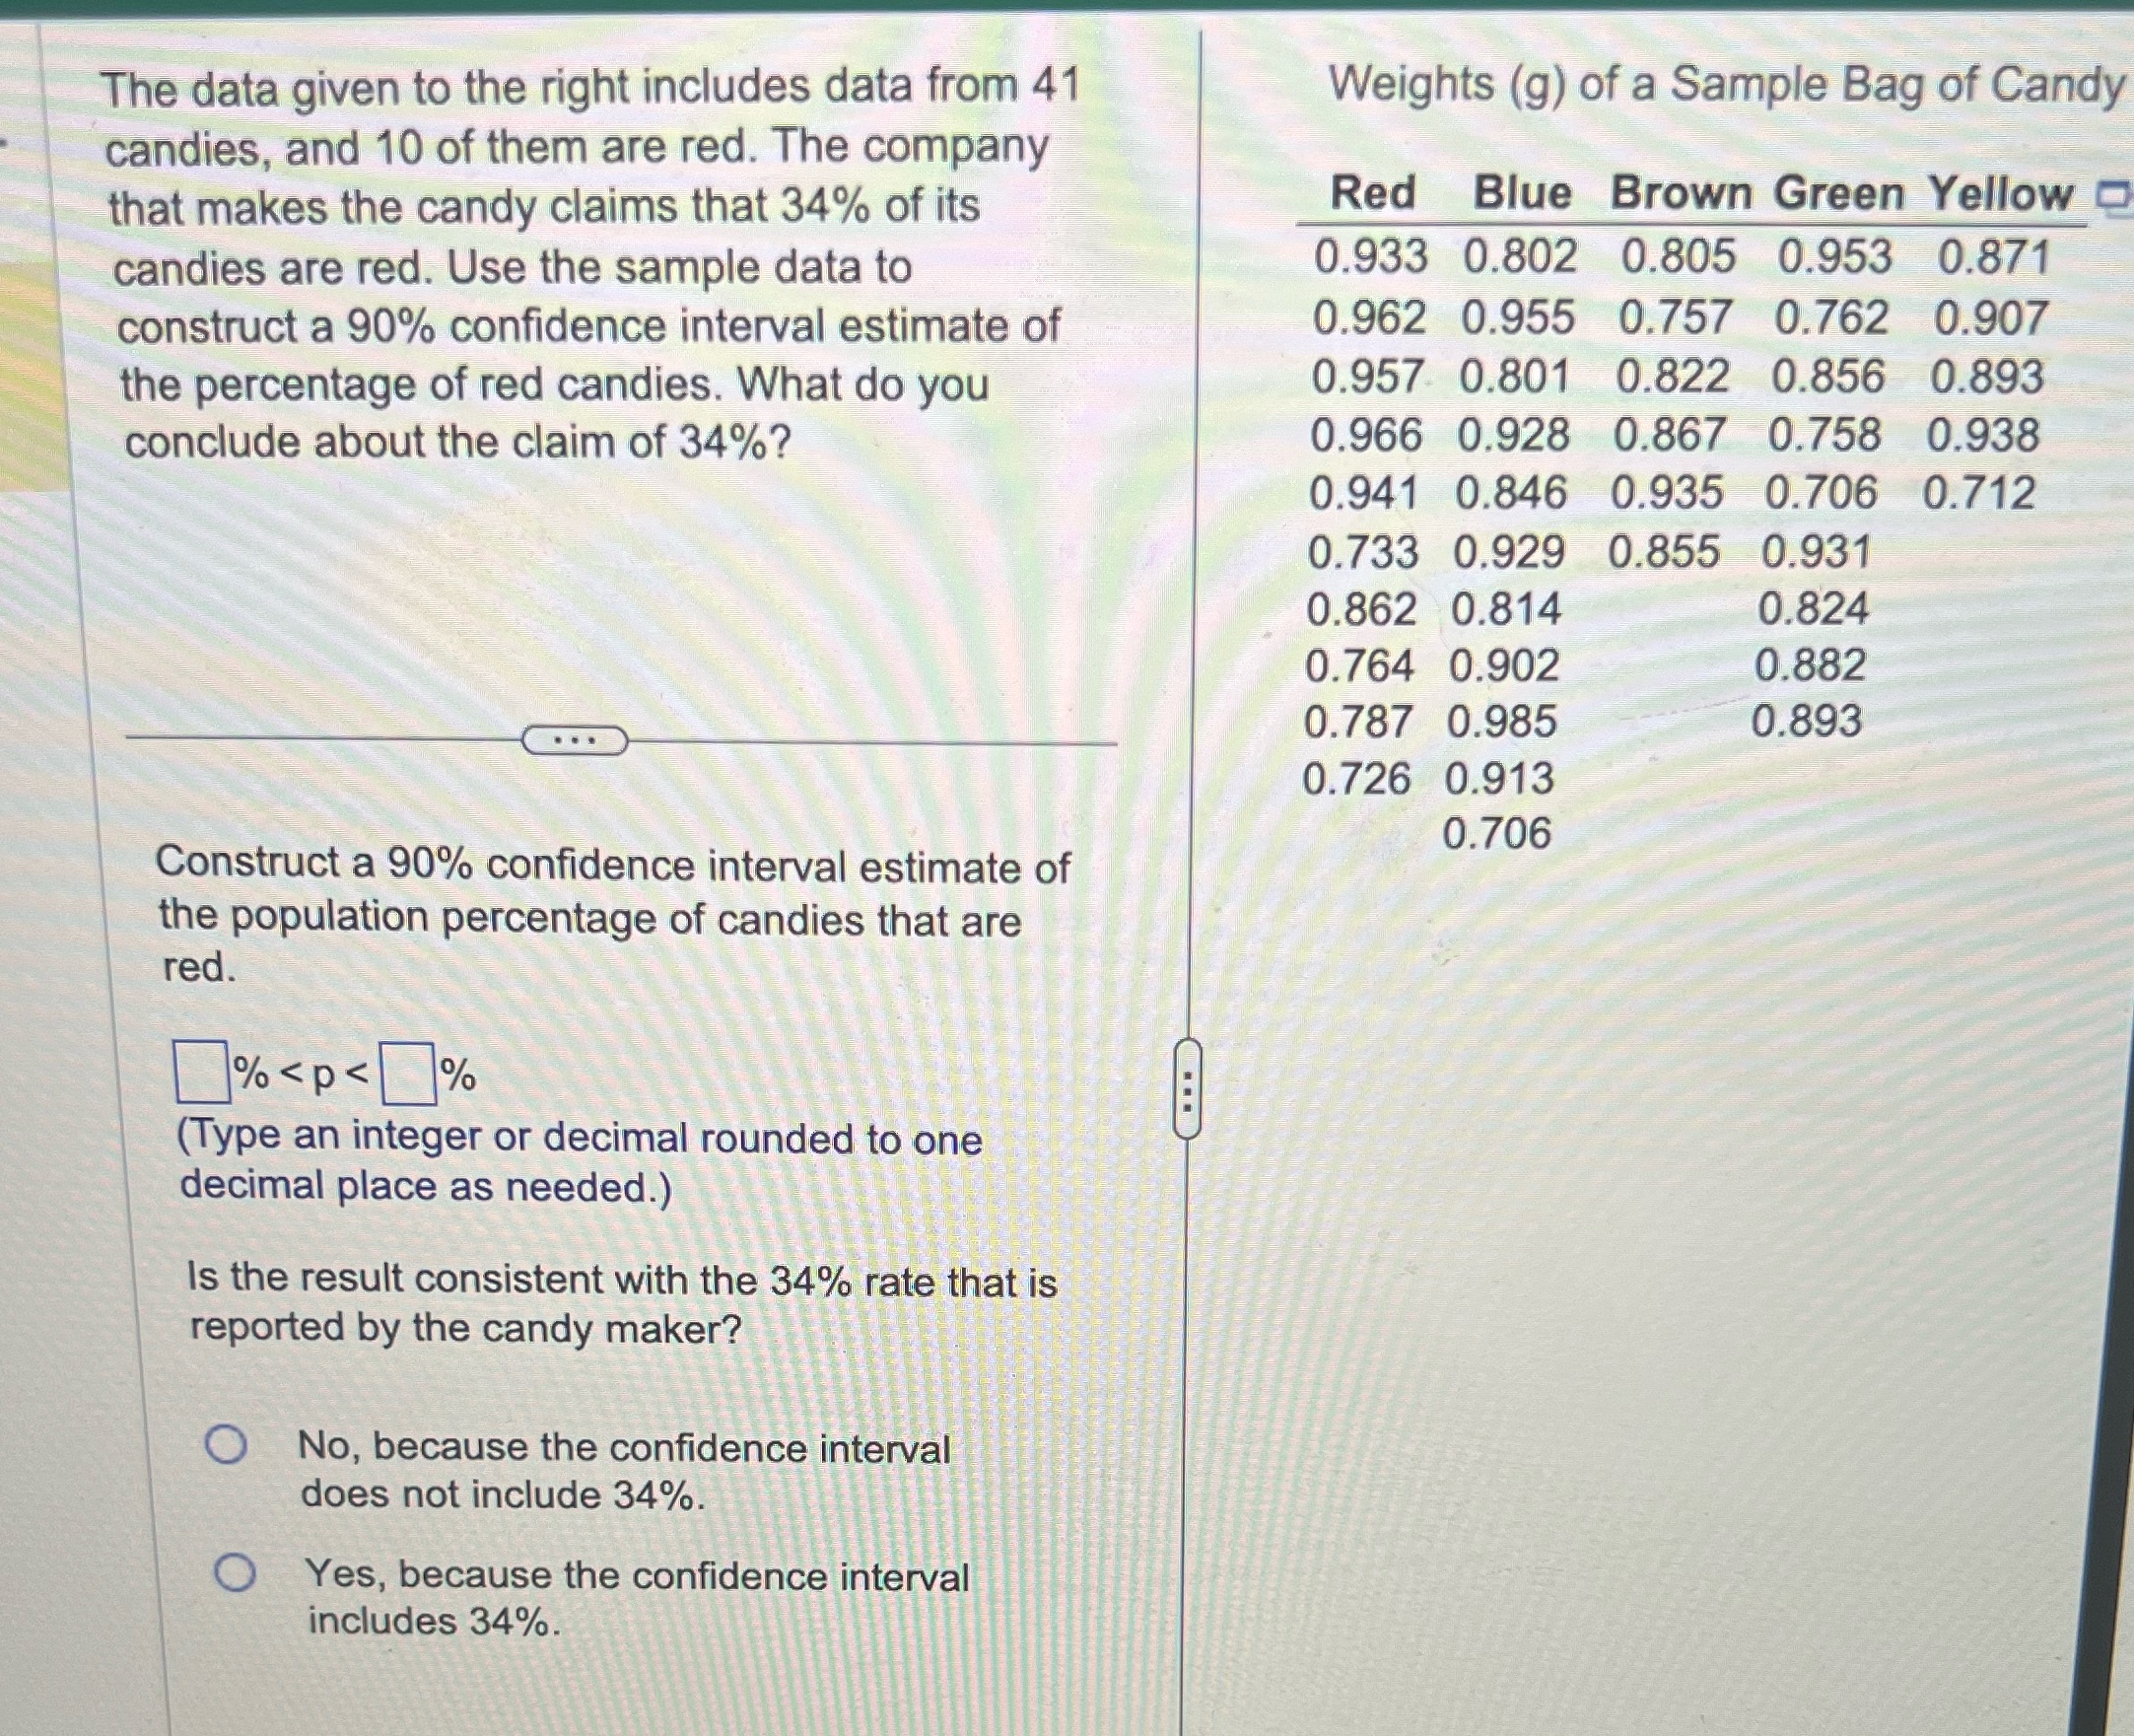
The data given to the right includes data from 41 Weights (g) of a Sample Bag of Candy candies, and 10 of them are red. The company that makes the candy claims that 34% of its Red Blue Brown Green Yellow candies are red. Use the sample data to 0.933 0.802 0.805 0.953 0.871 construct a 90% confidence interval estimate of 0.962 0.955 0.757 0.762 0.907 the percentage of red candies. What do you 0.957 0.801 0.822 0.856 0.893 conclude about the claim of 34%? 0.966 0.928 0.867 0.758 0.938 0.941 0.846 0.935 0.706 0.712 0.733 0.929 0.855 0.931 0.862 0.814 0.824 0.764 0.902 0.882 . . . 0.787 0.985 0.893 0.726 0.913 0.706 Construct a 90% confidence interval estimate of the population percentage of candies that are red. %
Step by Step Solution
There are 3 Steps involved in it

Get step-by-step solutions from verified subject matter experts