

Question: The data given to the right includes data from 41 candies, Weights (g) of a Sample Bag of Candy and 10 of them are red.
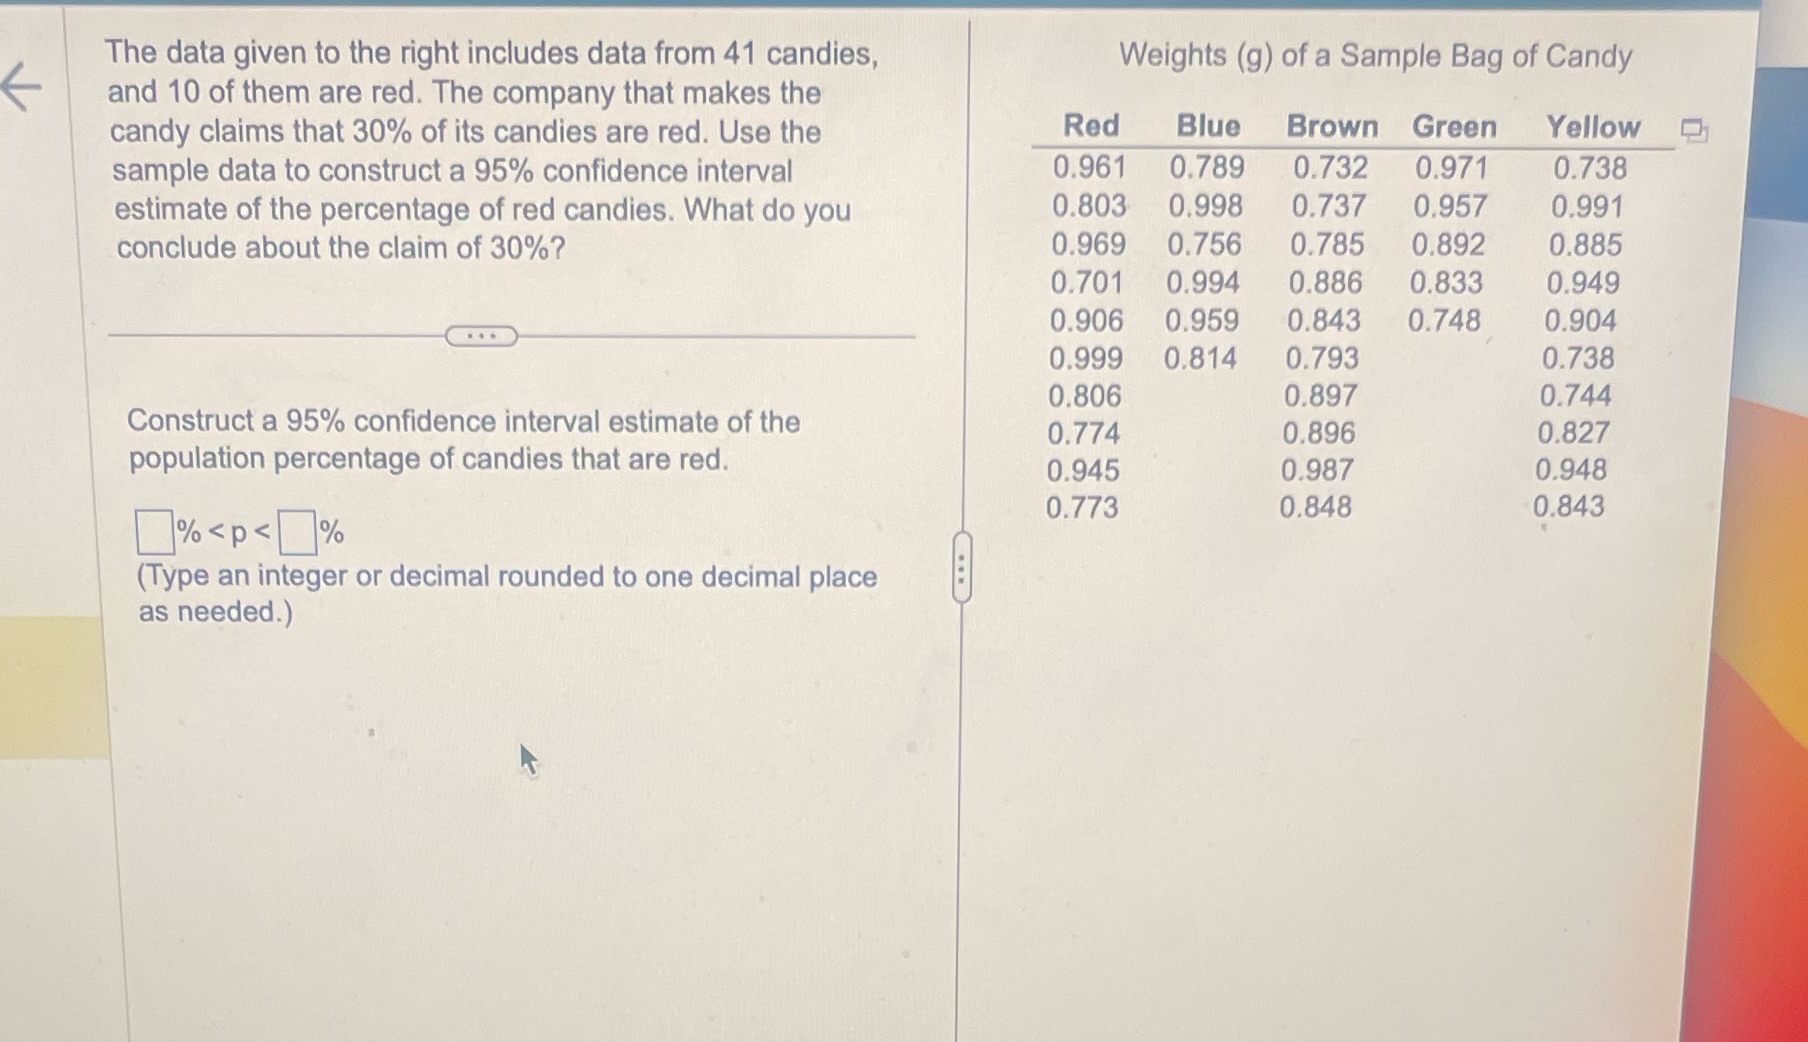
The data given to the right includes data from 41 candies, Weights (g) of a Sample Bag of Candy and 10 of them are red. The company that makes the candy claims that 30% of its candies are red. Use the Red Blue Brown Green Yellow sample data to construct a 95% confidence interval 0.961 0.789 0.732 0.971 0.738 estimate of the percentage of red candies. What do you 0.803 0.998 0.737 0.957 0.991 conclude about the claim of 30%? 0.969 0.756 0.785 0.892 0.885 0.701 0.994 0.886 0.833 0.949 0.906 0.959 0.843 0.748 0.904 0.999 0.814 0.793 0.738 0.806 0.897 0.744 Construct a 95% confidence interval estimate of the 0.774 0.896 0.827 population percentage of candies that are red. 0.945 0.987 0.948 1%
Step by Step Solution
There are 3 Steps involved in it

Get step-by-step solutions from verified subject matter experts