

Question: Question 2 The data in Table F gives the demand ( measured in ' 0 0 0 of viewership ) for a local television programme
Question
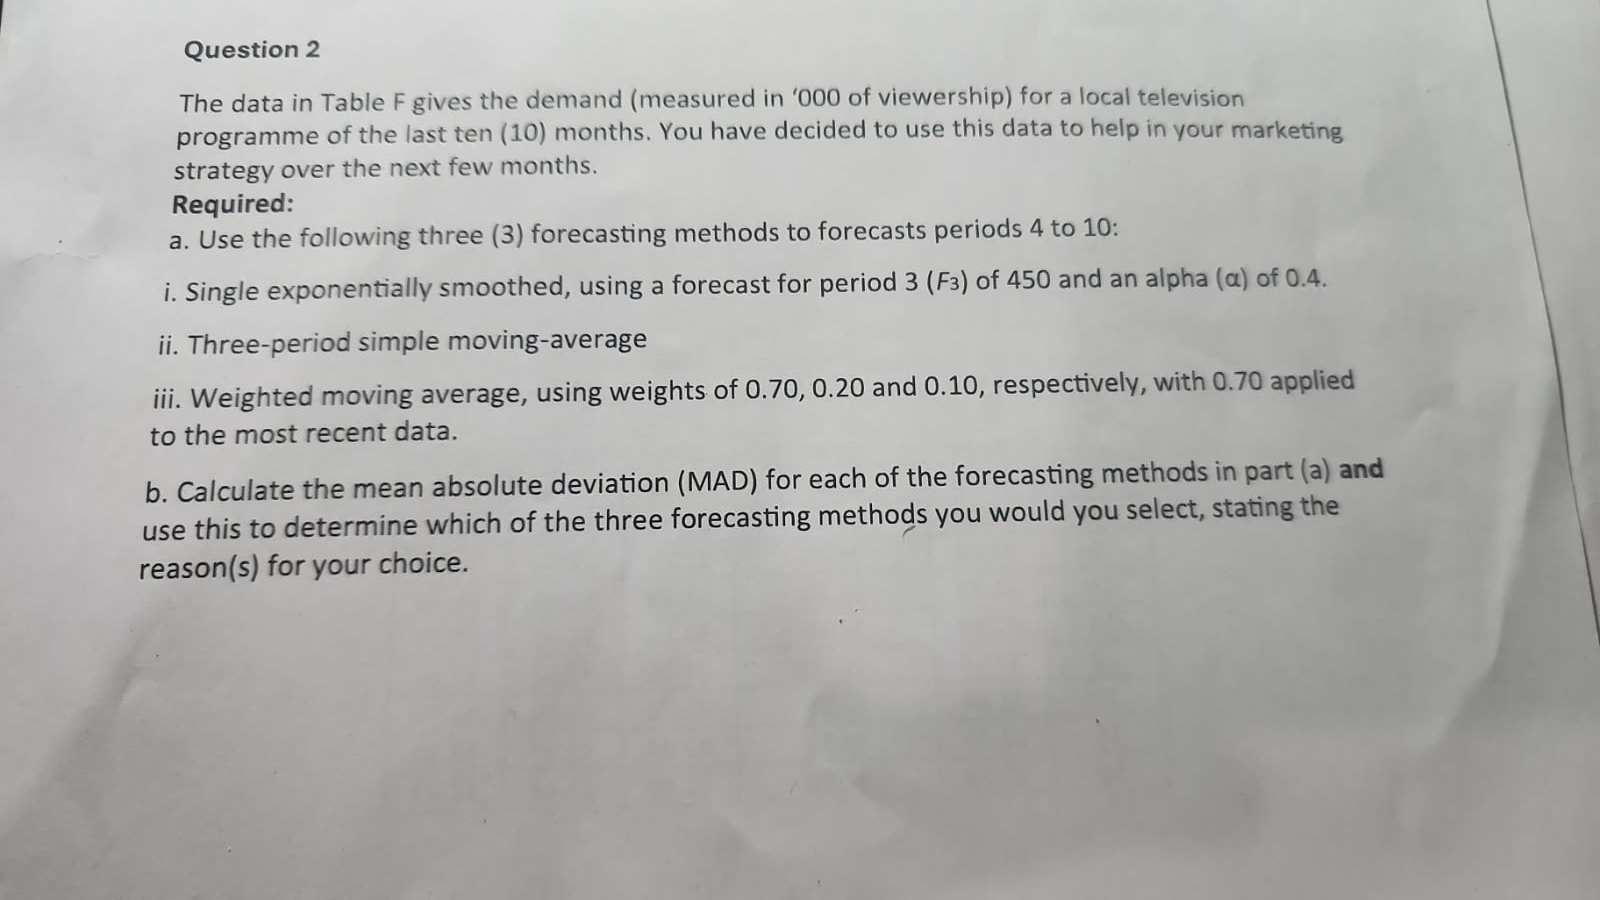
The data in Table F gives the demand measured in of viewership for a local television
programme of the last ten months. You have decided to use this data to help in your marketing
strategy over the next few months.
Required:
a Use the following three forecasting methods to forecasts periods to :
i Single exponentially smoothed, using a forecast for period of and an alpha of
ii Threeperiod simple movingaverage
iii. Weighted moving average, using weights of and respectively, with applied
to the most recent data.
b Calculate the mean absolute deviation MAD for each of the forecasting methods in part a and
use this to determine which of the three forecasting methods you would you select, stating the
reasons for your choice.
Step by Step Solution
There are 3 Steps involved in it
1 Expert Approved Answer
Step: 1 Unlock

Question Has Been Solved by an Expert!
Get step-by-step solutions from verified subject matter experts
Step: 2 Unlock
Step: 3 Unlock