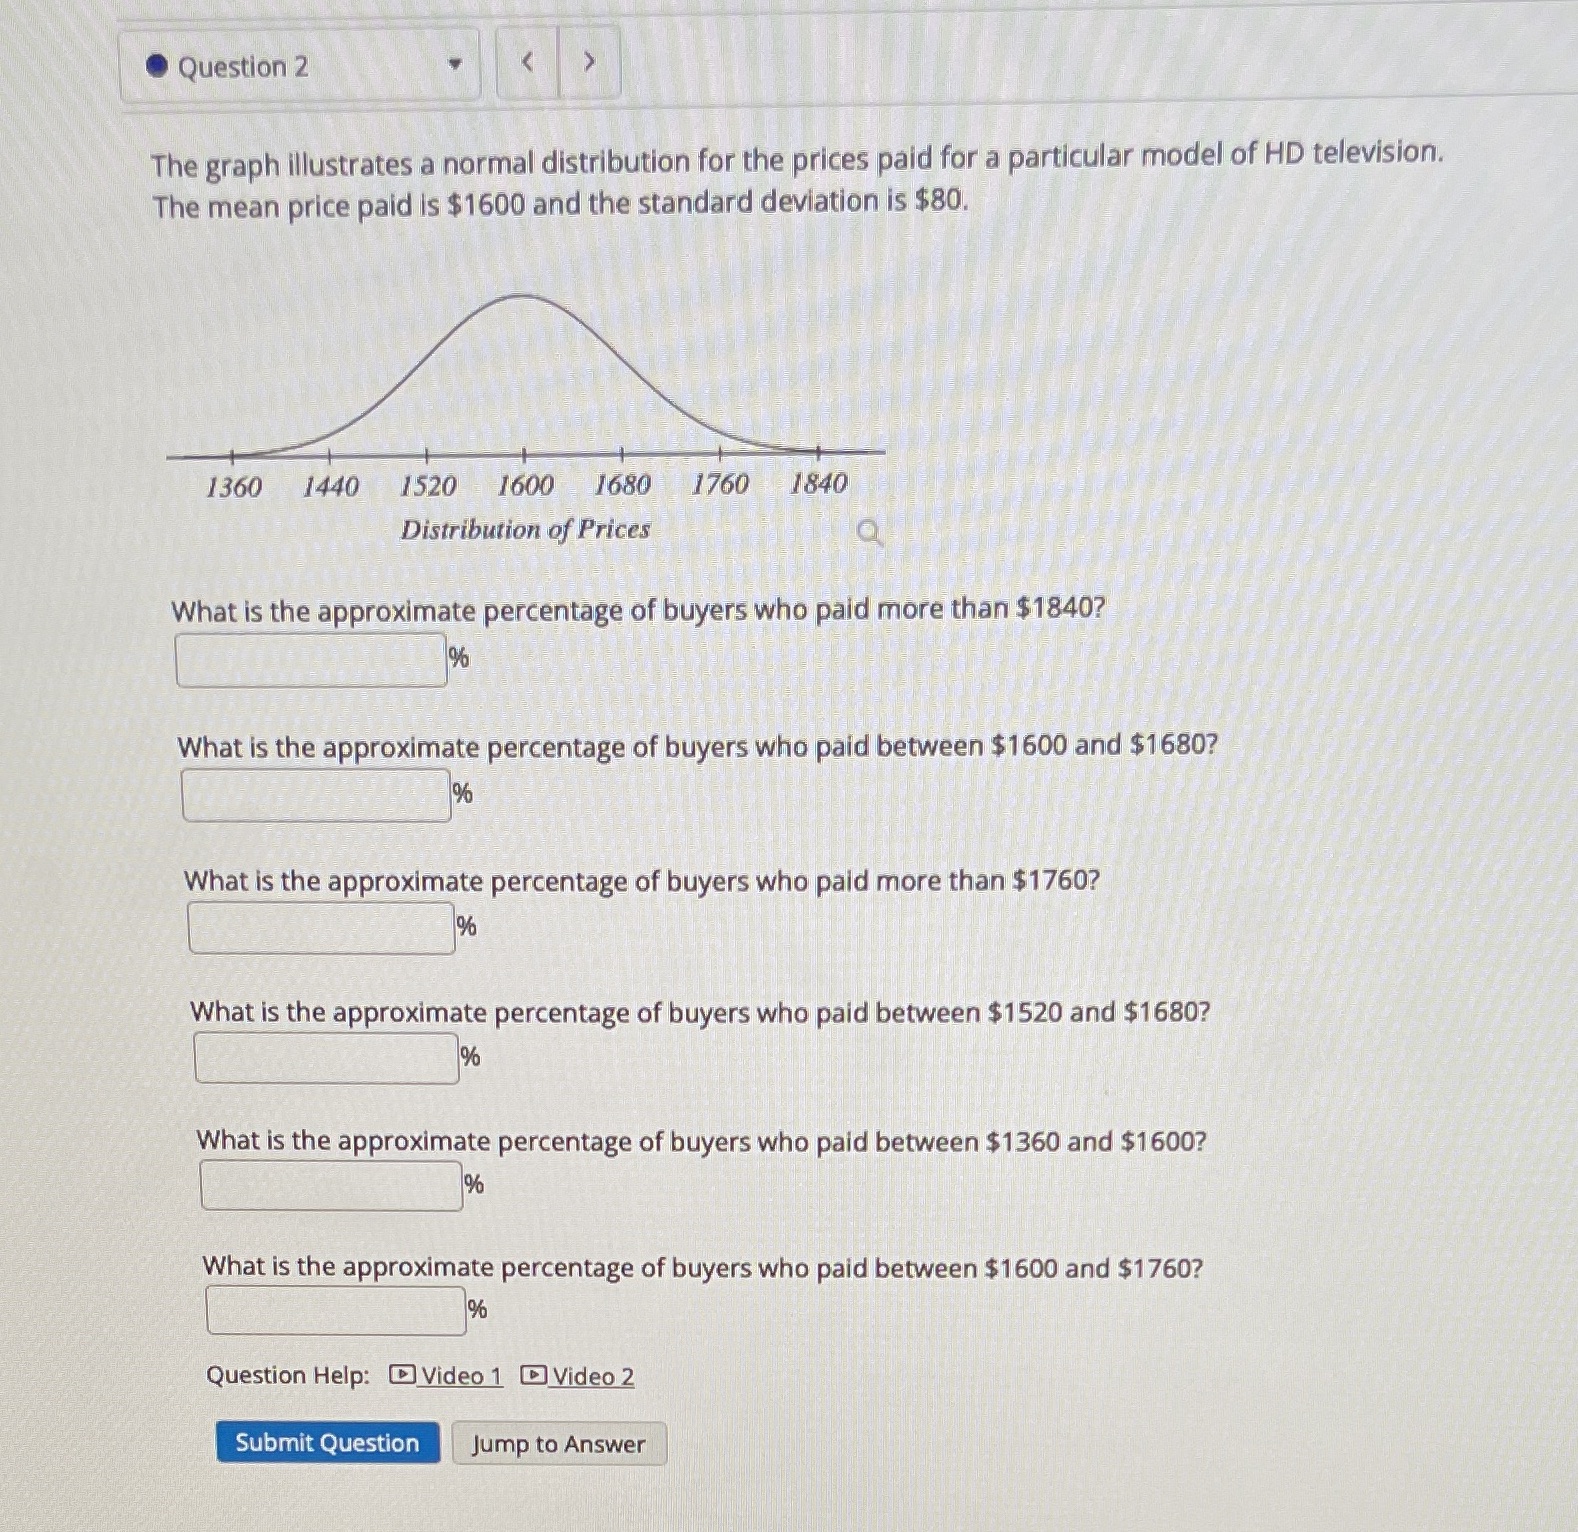
Question: .Question 2 The graph illustrates a normal distribution for the prices paid for a particular model of HD television. The mean price paid is $1600

.Question 2 The graph illustrates a normal
.Question 2 The graph illustrates a normal distribution for the prices paid for a particular model of HD television. The mean price paid is $1600 and the standard deviation is $80. 1360 1440 1520 1600 1680 1760 1840 Distribution of Prices What is the approximate percentage of buyers who paid more than $1840? What is the approximate percentage of buyers who paid between $1600 and $1680? What is the approximate percentage of buyers who paid more than $1760? What is the approximate percentage of buyers who paid between $1520 and $1680? % What is the approximate percentage of buyers who paid between $1360 and $1600? % What is the approximate percentage of buyers who paid between $1600 and $1760? Question Help: Video 1 Video 2 Submit Question Jump to

Step by Step Solution

There are 3 Steps involved in it

1 Expert Approved Answer
Step: 1 Unlock blur-text-image
Question Has Been Solved by an Expert!

Get step-by-step solutions from verified subject matter experts

Step: 2 Unlock
Step: 3 Unlock

Students Have Also Explored These Related Mathematics Questions!