

Question: Question 6 The graph illustrates a normal distribution for the prices paid for a particular model of HD television. The mean price paid is $1600
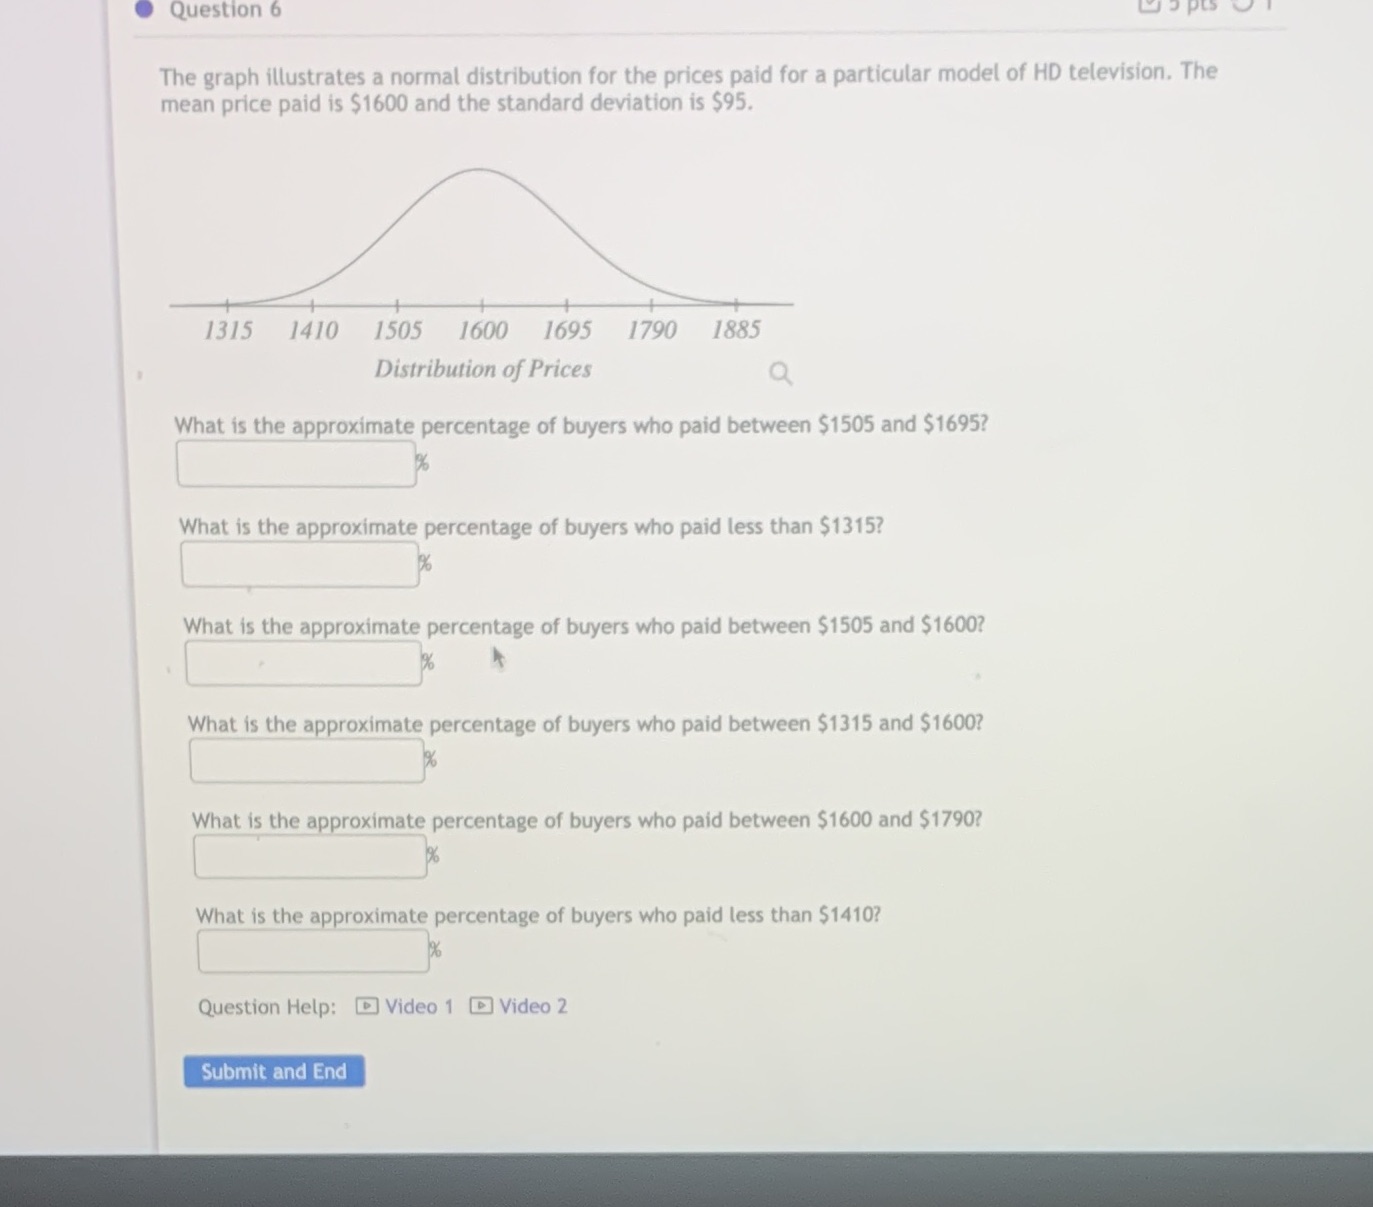
Question 6 The graph illustrates a normal distribution for the prices paid for a particular model of HD television. The mean price paid is $1600 and the standard deviation is $95. 1315 1410 1505 1600 1695 1790 1885 Distribution of Prices Q What is the approximate percentage of buyers who paid between $1505 and $1695? What is the approximate percentage of buyers who paid less than $1315? What is the approximate percentage of buyers who paid between $1505 and $1600? What is the approximate percentage of buyers who paid between $1315 and $1600? What is the approximate percentage of buyers who paid between $1600 and $1790? What is the approximate percentage of buyers who paid less than $1410? Question Help: Video 1 Video 2 Submit and End
Step by Step Solution
There are 3 Steps involved in it

Get step-by-step solutions from verified subject matter experts