

Question: Question #2 The information provided on the Taco Bell worksheet in the data pack can be used to estimate a demand curve for
Question #2
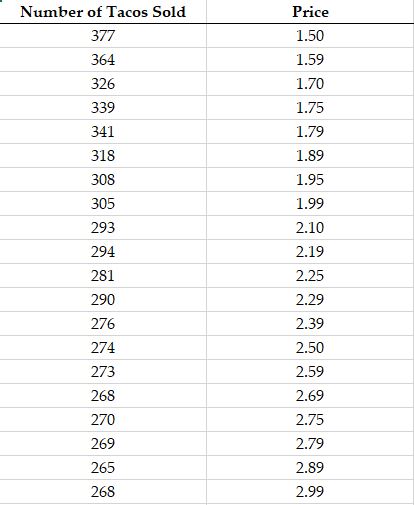
The information provided on the "Taco Bell" worksheet in the data pack can be used to estimate a demand curve for tacos. Estimate a regression equation with price (measured in dollars) as the independent variable.
a.Construct a 90% confidence interval for the average number of tacos sold per day when the price of a taco is $2.00. (5 marks)
Point Estimate:[insert here]
Excel Formula for t:[insert here]
syx:[insert here]
Standard Error:[insert here]
Margin of Error:[insert here]
Lower Confidence Limit:[insert here]
Upper Confidence Limit:[insert here]
Image attached for data
\f
Step by Step Solution
There are 3 Steps involved in it
1 Expert Approved Answer
Step: 1 Unlock

Question Has Been Solved by an Expert!
Get step-by-step solutions from verified subject matter experts
Step: 2 Unlock
Step: 3 Unlock