

Question: The table below includes statistics regarding Covid-19 in Ottawa since the start of the pandemic (according to Public Health Ottawa and the Ontario Ministry of
The table below includes statistics regarding Covid-19 in Ottawa since the start of the pandemic (according to Public Health Ottawa and the Ontario Ministry of Health). The number of new confirmed cases of Covid-19 grew exponentially over time during the first wave (March 25 to May 2). After May 2, a decline in the rate of new cases was observed because of the strict new rules to prevent the spread of the virus. However, after September 7, once the students returned to school, the number of new confirmed cases began to grow exponentially once again.
a) Plot the data (cumulative case over time) and identify periods of exponential growth.
b) Find the growth constant, k, for the first and second waves. (Use March 11 and September 7 as day 0 with the number of cases N0 = new case within 10 days, preceding, which is the number of people infected at time 0.)
c) Estimate the number of people infected at the end of November with the current k value and if the city
can cut the k-value in half thanks to tighter social distancing rules. Calculate the doubling time for each value of k.
1
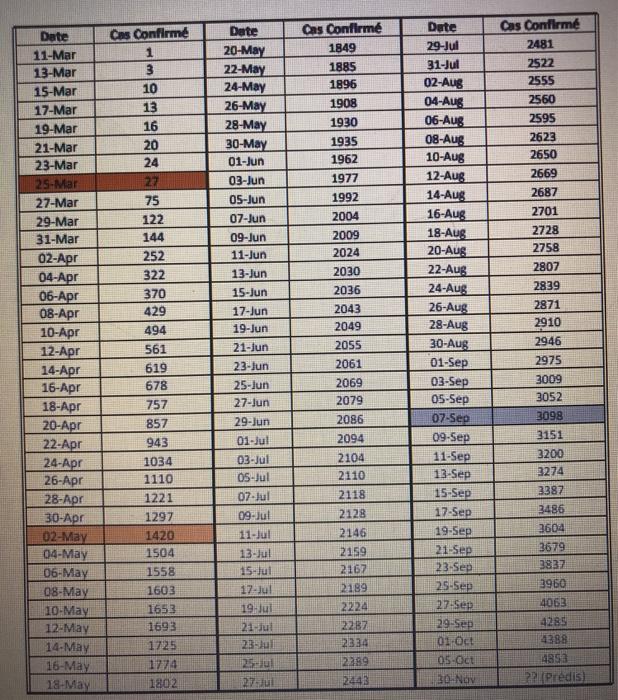
Date 11-Mar 13-Mar 15-Mar 17-Mar 19-Mar 21-Mar 23-Mar 25-Mar 27-Mar 29-Mar 31-Mar 02-Apr 04-Apr 06-Apr 08-Apr 10-Apr 12-Apr 14-Apr 16-Apr 18-Apr 20-Apr 22-Apr 24-Apr 26-Apr 28-Apr 30-Apr 02-May 04-May 06-May 08-May 10-May 12-May 14-May 16-May 18-May Cas Confirm 1 3 10 13 16 20 24 27 75 122 144 252 322 370 429 494 561 619 678 757 857 943 1034 1110 1221 1297 1420 1504 1558 1603 1653 1693 1725 1774 1802 Date 20-May 22-May 24-May 26-May 28-May 30-May 01-Jun 03-Jun 05-Jun 07-Jun 09-Jun 11-Jun 13-Jun 15-Jun 17-Jun 19-Jun 21-Jun 23-Jun 25-Jun 27-Jun 29-Jun 01-Jul 03-Jul 05-Jul 07-Jul 09-Jul 11-Jul 13-Jul 15-Jul 17-Jul 19-Jul 21-Jul 23-Jul 27-Jul Cas Confirm 1849 1885 1896 1908 1930 1935 1962 1977 1992 2004 2009 2024 2030 2036 2043 2049 2055 2061 2069 2079 2086 2094 2104 2110 2118 2128 2146 2159 2167 2189 2224 2287 2334 2389 2443 Date 29-Jul 31-Jul 02-Aug 04-Aug 06-Aug 08-Aug 10-Aug 12-Aug 14-Aug 16-Aug 18-Aug 20-Aug 22-Aug 24-Aug 26-Aug 28-Aug 30-Aug 01-Sep 03-Sep 05-Sep 07-Sep 09-Sep 11-Sep 13-Sep 15-Sep 17-Sep 19-Sep 21-Sep 23-Sep 25-Sep 27-Sep 29-Sep 01-Oct 05-Oct 30-Nov Cas Confirm 2481 2522 2555 2560 2595 2623 2650 2669 2687 2701 2728 2758 2807 2839 2871 2910 2946 2975 3009 3052 3098 3151 3200 3274 3387 3486 3604 3679 3837 3960 4063 4285 4388 4853 22 (Prdis)
Step by Step Solution
3.32 Rating (152 Votes )
There are 3 Steps involved in it
Plot the data cumulative case over time and identify periods of exponential growth The cumulative ca... View full answer

Get step-by-step solutions from verified subject matter experts