

Question: Question 20 (Mandatory) (1 point) This graph shows an index from 2000 to 2006. What was the average rate of change per year for this
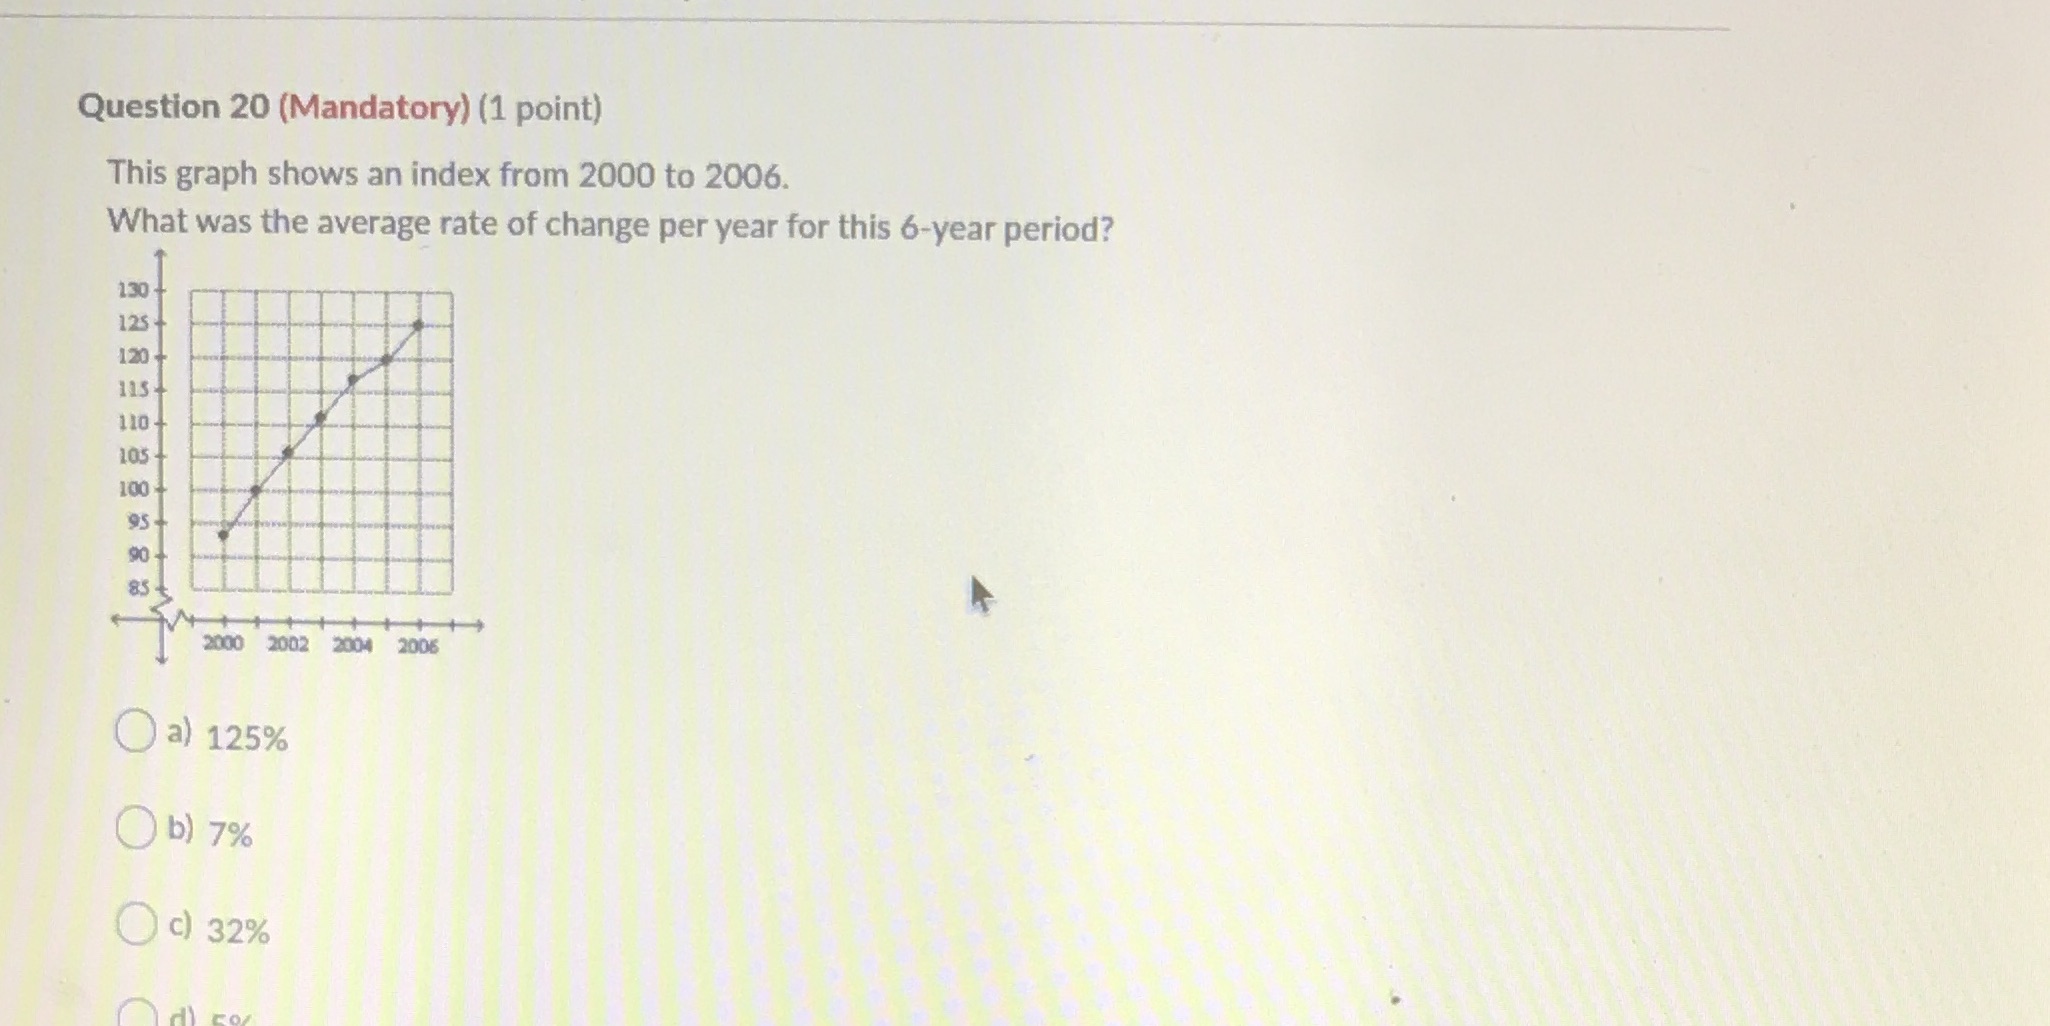

Question 20 (Mandatory) (1 point) This graph shows an index from 2000 to 2006. What was the average rate of change per year for this 6-year period? 130 125 120 1154 110- 105 100 954 90 85 2000 2002 2004 2006 ( a) 125% O b) 7% c 32%
Step by Step Solution
There are 3 Steps involved in it
1 Expert Approved Answer
Step: 1 Unlock

Question Has Been Solved by an Expert!
Get step-by-step solutions from verified subject matter experts
Step: 2 Unlock
Step: 3 Unlock