

Question: Question 22 (4 points) Saved Scatter plots are used to discover relationships between variables. Using the corresponding measurements of variable1 and variable2 in DATA,
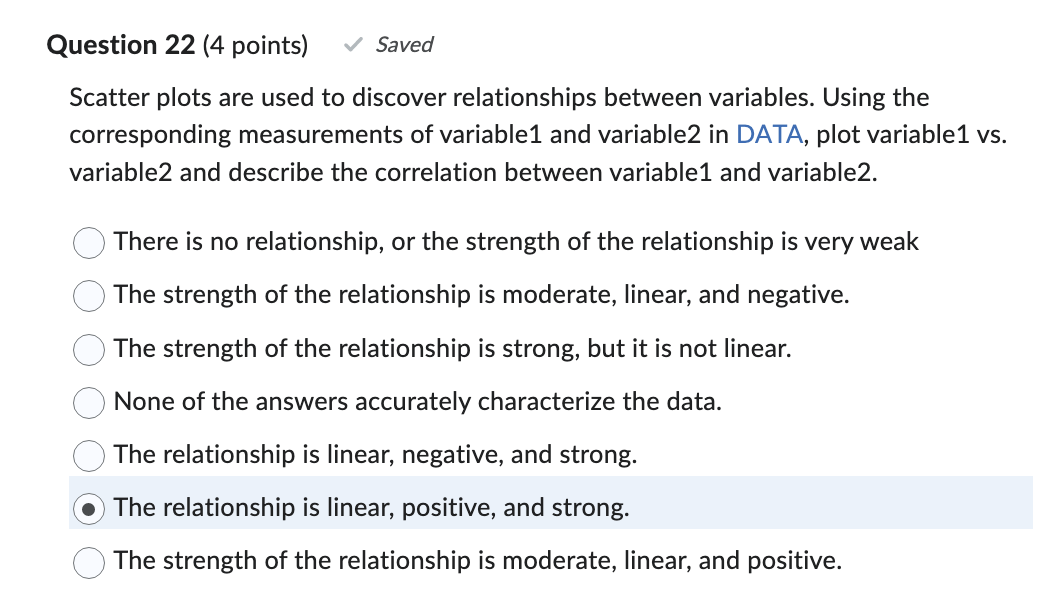
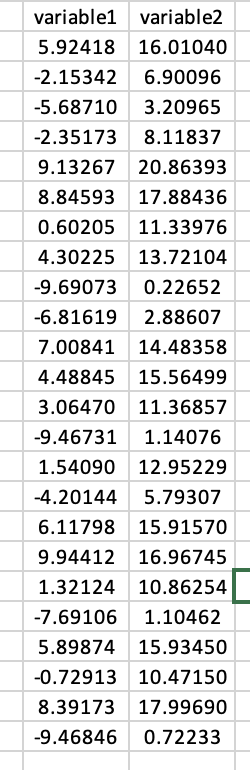
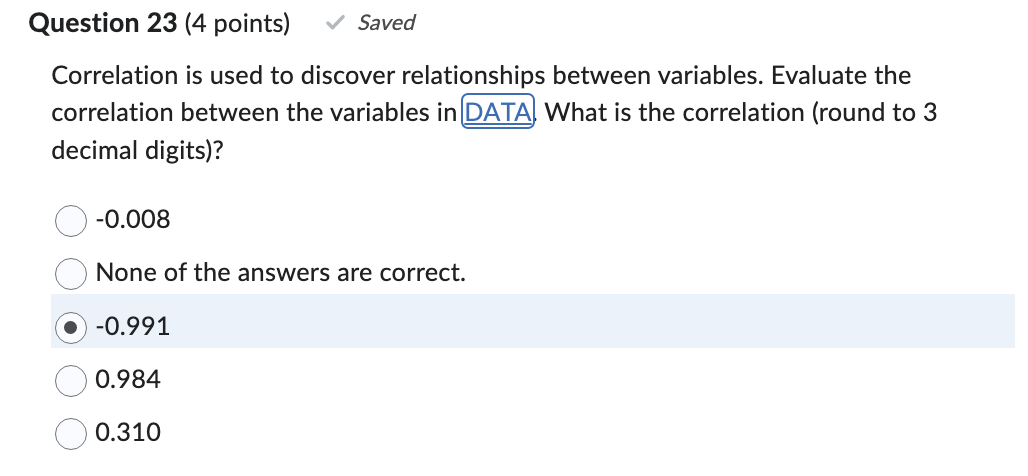
Question 22 (4 points) Saved Scatter plots are used to discover relationships between variables. Using the corresponding measurements of variable1 and variable2 in DATA, plot variable1 vs. variable2 and describe the correlation between variable1 and variable2. There is no relationship, or the strength of the relationship is very weak The strength of the relationship is moderate, linear, and negative. The strength of the relationship is strong, but it is not linear. None of the answers accurately characterize the data. The relationship is linear, negative, and strong. The relationship is linear, positive, and strong. The strength of the relationship is moderate, linear, and positive. variable1 variable2 5.92418 16.01040 -2.15342 6.90096 -5.68710 3.20965 -2.35173 8.11837 9.13267 20.86393 8.84593 17.88436 0.60205 11.33976 4.30225 13.72104 -9.69073 0.22652 -6.81619 2.88607 7.00841 14.48358 4.48845 15.56499 3.06470 11.36857 -9.46731 1.14076 1.54090 12.95229 -4.20144 5.79307 6.11798 15.91570 9.94412 16.96745 1.32124 10.86254 -7.69106 1.10462 5.89874 15.93450 -0.72913 10.47150 8.39173 17.99690 -9.46846 0.72233 Question 23 (4 points) Saved Correlation is used to discover relationships between variables. Evaluate the correlation between the variables in DATA What is the correlation (round to 3 decimal digits)? -0.008 None of the answers are correct. -0.991 0.984 0.310
Step by Step Solution
There are 3 Steps involved in it

Get step-by-step solutions from verified subject matter experts