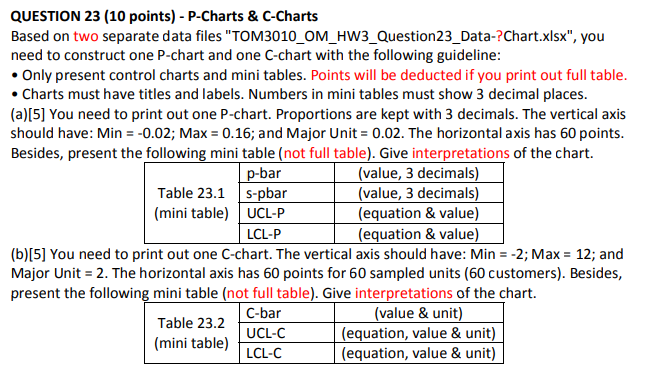
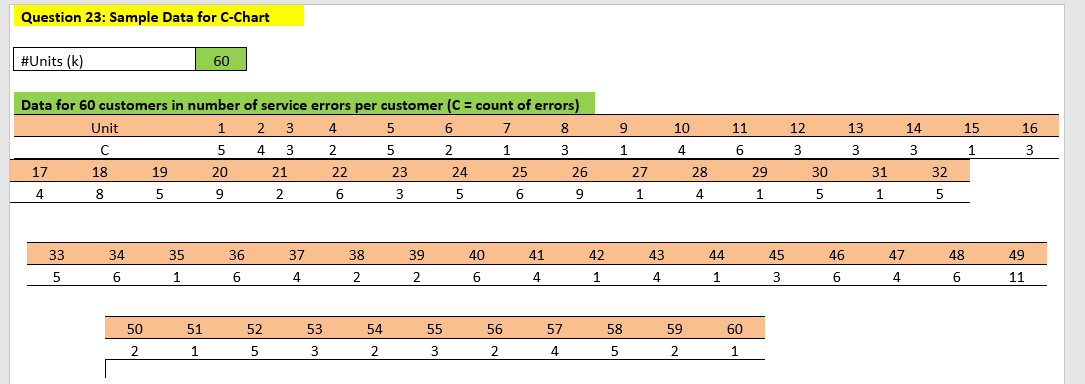
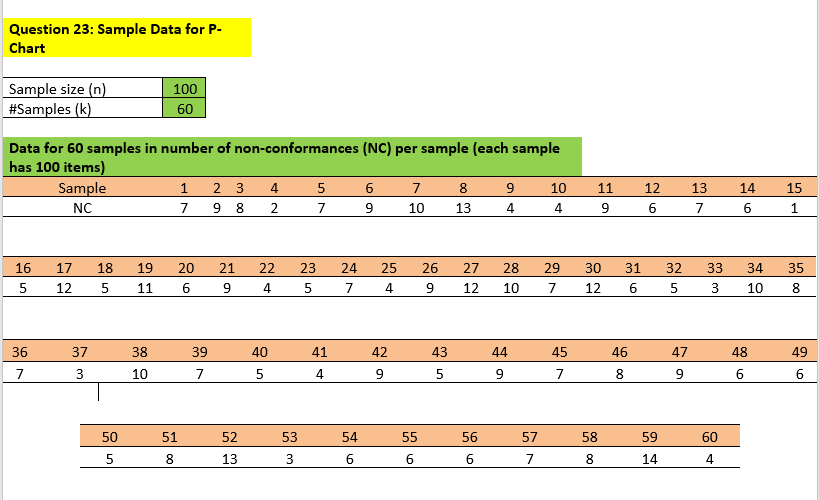
Question: QUESTION 23 (10 points) - P-Charts & C-Charts Based on two separate data files TOM3010_OM_HW3_Question23_Data-Chart.xlsx, you need to construct one p-chart and one C-chart with

QUESTION 23 (10 points) - P-Charts & C-Charts

QUESTION 23 (10 points) - P-Charts & C-Charts

QUESTION 23 (10 points) - P-Charts & C-Charts

QUESTION 23 (10 points) - P-Charts & C-Charts Based on two separate data files "TOM3010_OM_HW3_Question23_Data-Chart.xlsx", you need to construct one p-chart and one C-chart with the following guideline: Only present control charts and mini tables. Points will be deducted if you print out full table Charts must have titles and labels. Numbers in mini tables must show 3 decimal places. (a)[5] You need to print out one p-chart. Proportions are kept with 3 decimals. The vertical axis should have: Min = -0.02; Max = 0.16; and Major Unit = 0.02. The horizontal axis has 60 points. Besides, present the following mini table (not full table). Give interpretations of the chart. p-bar (value, 3 decimals) Table 23.1 s-pbar (value, 3 decimals) (mini table) UCL-P (equation & value) LCL-P (equation & value) (b)(5) You need to print out one C-chart. The vertical axis should have: Min = -2; Max = 12; and Major Unit = 2. The horizontal axis has 60 points for 60 sampled units (60 customers). Besides, present the following mini table (not full table). Give interpretations of the chart. C-bar (value & unit) Table 23.2 UCL-C (equation, value & unit) (mini table) LCL-C (equation, value & unit) Question 23: Sample Data for C-Chart #Units (k) 60 Unit 15 Data for 60 customers in number of service errors per customer (C = count of errors) - 1 2 3 4 5 6 7 8 9 10 11 12 13 14 5 4 3 2 5 2 1 3 1 4 6 3 3 3 - 17 18 19 20 21 22 23 24 25 26 27 28 29 30 31 32 4 8 5 9 2 6 3 5 6 91 41 51 5 16 3 1 35 42 44 - 33 5 34 6 36 6 37 4 38 2 39 2 40 6 41 4 43 4 45 3 46 6 47 4 48 6 49 11 1 1 1 50 2 51 52 5 53 3 54 2 55 3 56 57 58 2 4 5 59 2 60 1 1 Question 23: Sample Data for P- Chart 100 Sample size (n) #Samples (k) 60 Data for 60 samples in number of non-conformances (NC) per sample (each sample has 100 items) Sample 1 2 3 4 5 6 7 8 9 10 NC 7 9 8 2 7 9 10 13 4 4 11 9 12 6 13 7 14 6 15 1 16 5 17 12 18 5 19 11 20 6 21 9 22 4 23 5 24 7 25 4 26 9 27 12 28 10 29 7 30 12 31 6 32 5 33 3 34 10 35 8 36 37 38 39 40 41 42 43 44 45 46 47 48 49 17 3 10 7 5 4 95 978 96 6 57 50 5 51 8 52 13 53 3 54 6 55 6 56 6 58 8 59 14 60 4. 7

Step by Step Solution

There are 3 Steps involved in it

1 Expert Approved Answer
Step: 1 Unlock blur-text-image
Question Has Been Solved by an Expert!

Get step-by-step solutions from verified subject matter experts

Step: 2 Unlock
Step: 3 Unlock

Students Have Also Explored These Related General Management Questions!