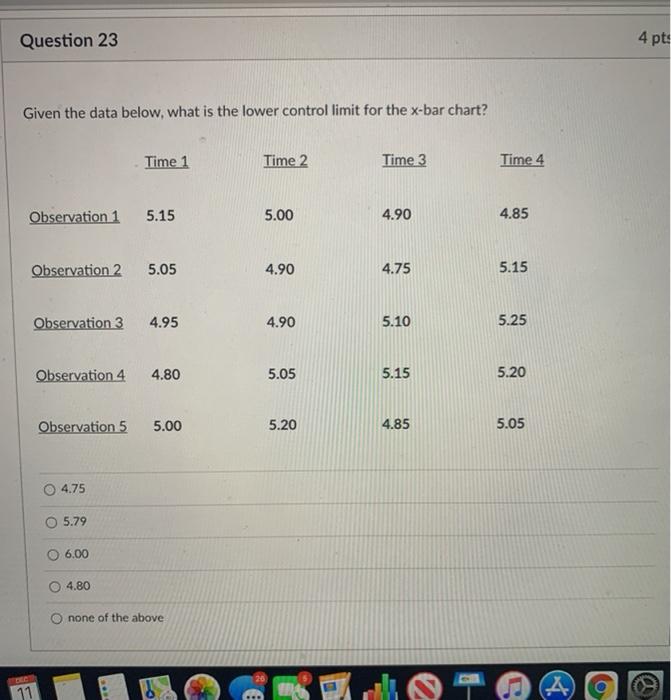
Question: Question 23 4 pt: Given the data below, what is the lower control limit for the x-bar chart? Time 1 Time 2 Time 3 Time

Question 23 4 pt: Given the data below, what is
Question 23 4 pt: Given the data below, what is the lower control limit for the x-bar chart? Time 1 Time 2 Time 3 Time 4 Observation 1 5.15 5.00 4.90 4.85 Observation 2 5.05 4.90 4.75 5.15 Observation 3 4.95 4.90 5.10 5.25 Observation 4 4.80 5.05 5.15 5.20 Observation 5 5.00 5.20 4.85 5.05 4.75 O 5.79 6.00 4.80 none of the above 4 11

Step by Step Solution

There are 3 Steps involved in it

1 Expert Approved Answer
Step: 1 Unlock blur-text-image
Question Has Been Solved by an Expert!

Get step-by-step solutions from verified subject matter experts

Step: 2 Unlock
Step: 3 Unlock

Students Have Also Explored These Related General Management Questions!