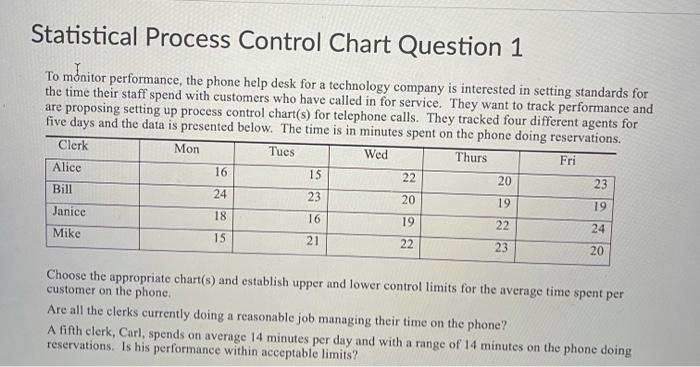
Question: Statistical Process Control Chart Question 1 To mnitor performance, the phone help desk for a technology company is interested in setting standards for the time

Statistical Process Control Chart Question 1 To
Statistical Process Control Chart Question 1 To mnitor performance, the phone help desk for a technology company is interested in setting standards for the time their staff spend with customers who have called in for service. They want to track performance and are proposing setting up process control chart(s) for telephone calls. They tracked four different agents for five days and the data is presented below. The time is in minutes spent on the phone doing reservations. Clerk Mon Thurs Tues Wed Alice Fri 16 15 22 20 23 Bill 24 23 20 19 Janice 19 18 16 19 22 Mike 24 15 21 22 23 20 Choose the appropriate chart(s) and establish upper and lower control limits for the average time spent per customer on the phone, Are all the clerks currently doing a reasonable job managing their time on the phone? A fifth clerk, Carl, spends on average 14 minutes per day and with a range of 14 minutes on the phone doing reservations. Is his performance within acceptable limits? Question 2 (2.5 points) What is the upper control limit? If you chose an x-bar and r-bar chart enter your x- bar chart upper controllimit here and the r-bar upper control limit in question 4. Your Answer: Your Answer Add attachments to support your work Question 3 (2.5 points) What is the lower control limit? If you chose an x-bar and r-bar chart enter your x- bar chart lower controllimit here and the r-bar upper lower limit in question 5. Your Answer: 3 Your Answer Question 4 (2 points) What is the second upper control limit? If you chose an x-bar and r-bar chart enter your r-bar chart upper control limit here. If you chose a p-chart or a c-chart enter 100 here. Your Answer: Your Answer Question 5 (2 points) What is the second lower control limit? If you chose an x-bar and r-bar chart enter your robar chart lower control limit here. If you chose a p-chart or a c-chart enter 100 here. Your Answer: Your

Step by Step Solution

There are 3 Steps involved in it

1 Expert Approved Answer
Step: 1 Unlock blur-text-image
Question Has Been Solved by an Expert!

Get step-by-step solutions from verified subject matter experts

Step: 2 Unlock
Step: 3 Unlock

Students Have Also Explored These Related General Management Questions!