

Question: Question 23: Which material does not display significant seasonality? 38. Remove the chart. Include only Customer Desc in Rows. Revenue in Values. Right click Revenue
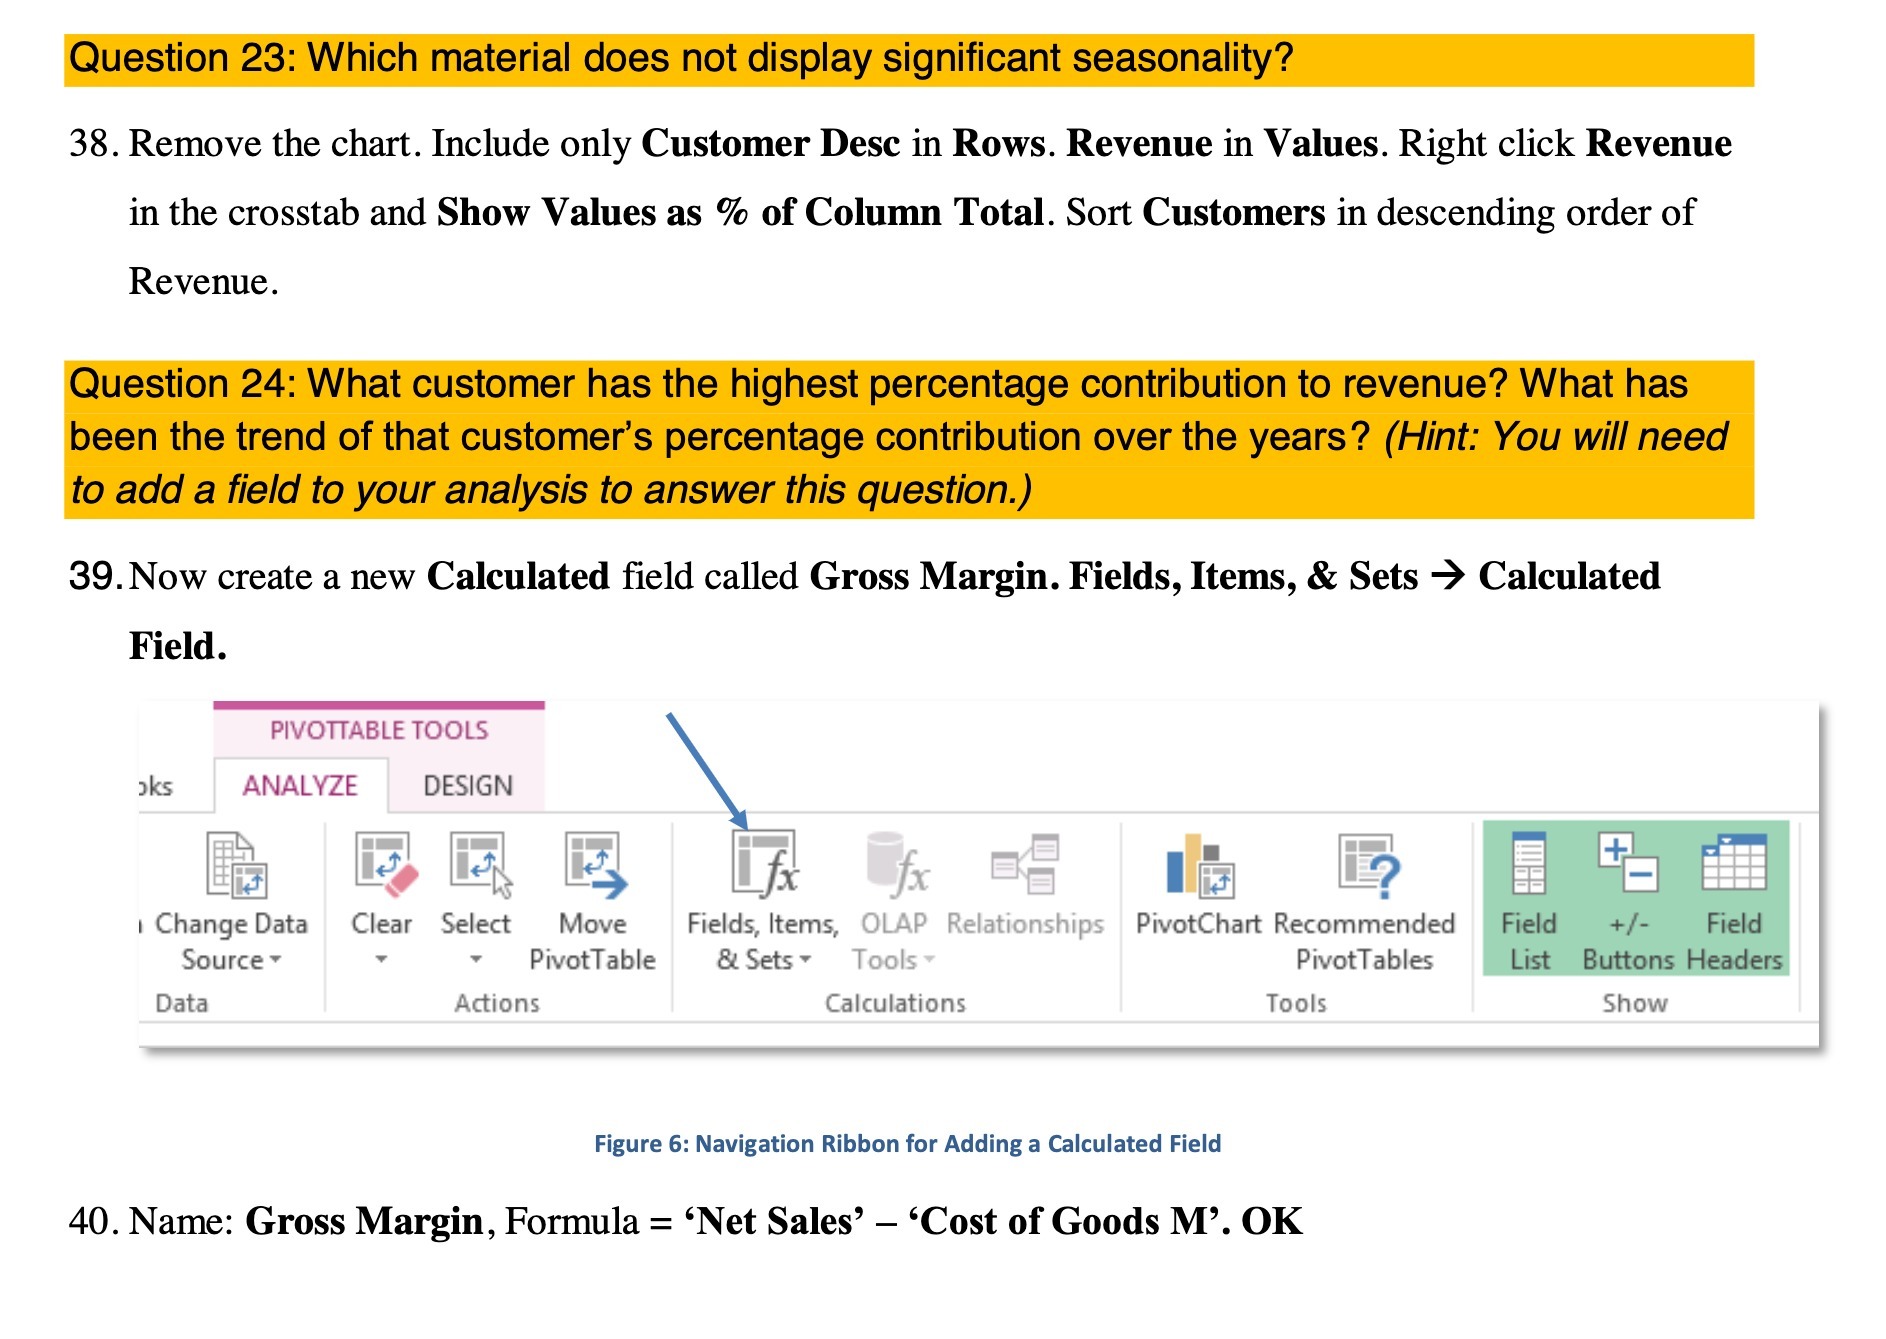
Question 23: Which material does not display significant seasonality? 38. Remove the chart. Include only Customer Desc in Rows. Revenue in Values. Right click Revenue in the crosstab and Show Values as % of Column Total. Sort Customers in descending order of Revenue. Question 24: What customer has the highest percentage contribution to revenue? What has been the trend of that customer's percentage contribution over the years? (Hint: You will need to add a field to your analysis to answer this question.) 39. Now create a new Calculated field called Gross Margin. Fields, Items, & Sets -> Calculated Field. PIVOTTABLE TOOLS oks ANALYZE DESIGN 13 + I Change Data Clear Select Move Fields, Items, OLAP Relationships PivotChart Recommended Field +/- Field Source PivotTable & Sets Tools Pivot Tables List Buttons Headers Data Actions Calculations Tools Show Figure 6: Navigation Ribbon for Adding a Calculated Field 40. Name: Gross Margin, Formula = 'Net Sales' - 'Cost of Goods M'. OK
Step by Step Solution
There are 3 Steps involved in it

Get step-by-step solutions from verified subject matter experts