

Question: Select the table that represents the following graph. YA 4 3. 22 1. -4 -3 -2 1 2 3 -1 -2 -3, -4 -5

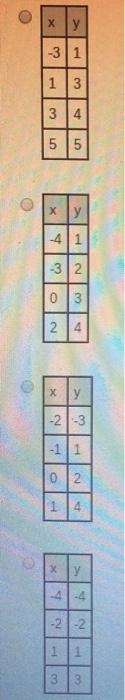
Select the table that represents the following graph. YA 4 3. 22 1. -4 -3 -2 1 2 3 -1 -2 -3, -4 -5 4) y y 4 y -2-3 4 xy -4 -2 1. 3. 4. 1. 2. 3, 1. 2. 1. 3. 2. 1. 3.
Step by Step Solution
★★★★★
3.48 Rating (161 Votes )
There are 3 Steps involved in it
1 Expert Approved Answer
Step: 1 Unlock

55 4 34 3 31 ... View full answer
Question Has Been Solved by an Expert!
Get step-by-step solutions from verified subject matter experts
Step: 2 Unlock
Step: 3 Unlock