

Question: Question (25 points) Simulating the 20-Year Financial Plan: Next Tom wants to design a spread model to incorporate the random variability of the annual salary
Question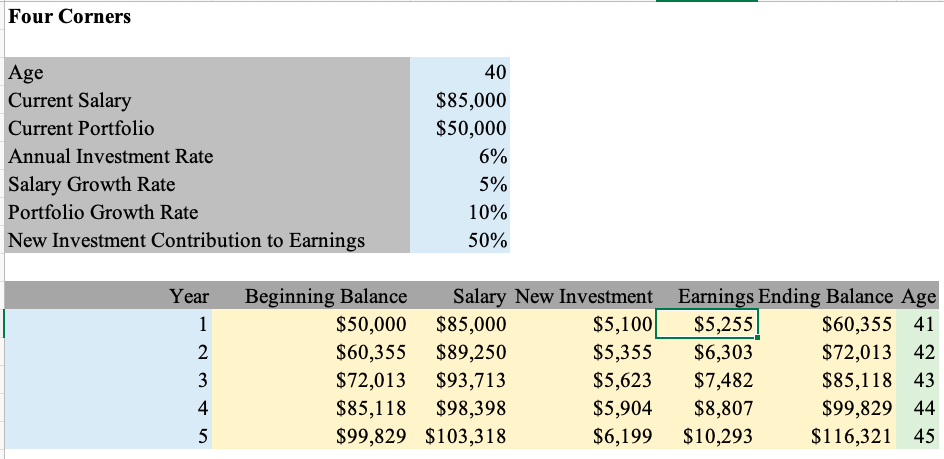
(25 points) Simulating the 20-Year Financial Plan: Next Tom wants to design a spread model to incorporate the random variability of the annual salary growth rate and the annual portfolio growth rate into a simulation model. He has decided to use the required annual investment rate found at the end of question 4. To show how to simulate a 20-year financial plan, provide a list of the steps that will be followed, [5 points] First make sure in your spreadsheet you have section for a single simulation trial. Provide a screenshot of your spreadsheet (including parameters and the 20-year financial planning results). [5 points] Execute 1000 simulation trials. Present which method has been used in this simulation with some details. In your report, share the values of the 20-year portfolio for the first five and last five simulation trials. [5 points] Analyze the output of the 1000 simulation trials using appropriate summary statistics and data visualizations of your choice. Present a screenshot of your output analysis and your interpretations. [10 points] Make sure the probability of reaching the 20-year portfolio size of $1,000,000 is calculated. Also comment on the uncertainty associated with Tom reaching the 20-year portfolio size of $1,000,000. Make sure the confidence interval for the 20-year portfolio size is calculated.
Four Corners Age Current Salary Current Portfolio Annual Investment Rate Salary Growth Rate Portfolio Growth Rate New Investment Contribution to Earnings 40 $85,000 $50,000 6% 5% 10% 50% Year 1 2 Beginning Balance Salary New Investment $50,000 $85,000 $5,100 $60,355 $89,250 $5,355 $72,013 $93,713 $5,623 $85,118 $98,398 $5,904 $99,829 $103,318 $6,199 Earnings Ending Balance Age $5,255 $60,355 41 $6,303 $72,013 42 $7,482 $85,118 43 $8,807 $99,829 44 $10,293 $116,321 45 3 4 5 Four Corners Age Current Salary Current Portfolio Annual Investment Rate Salary Growth Rate Portfolio Growth Rate New Investment Contribution to Earnings 40 $85,000 $50,000 6% 5% 10% 50% Year 1 2 Beginning Balance Salary New Investment $50,000 $85,000 $5,100 $60,355 $89,250 $5,355 $72,013 $93,713 $5,623 $85,118 $98,398 $5,904 $99,829 $103,318 $6,199 Earnings Ending Balance Age $5,255 $60,355 41 $6,303 $72,013 42 $7,482 $85,118 43 $8,807 $99,829 44 $10,293 $116,321 45 3 4 5Step by Step Solution
There are 3 Steps involved in it

Get step-by-step solutions from verified subject matter experts