

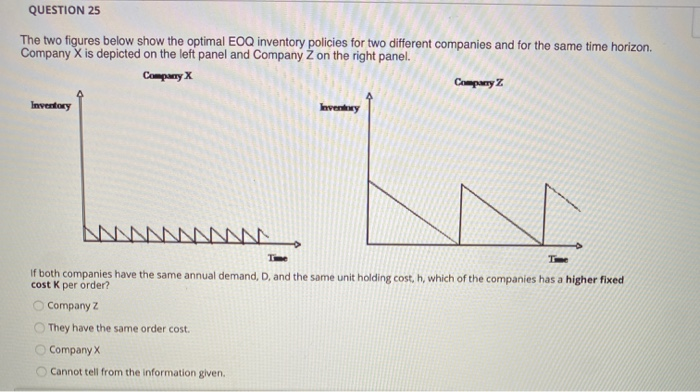
Question: QUESTION 25 The two figures below show the optimal EOQ inventory policies for two different companies and for the same time horizon. Company X is
Step by Step Solution
There are 3 Steps involved in it
1 Expert Approved Answer
Step: 1 Unlock

Question Has Been Solved by an Expert!
Get step-by-step solutions from verified subject matter experts
Step: 2 Unlock
Step: 3 Unlock