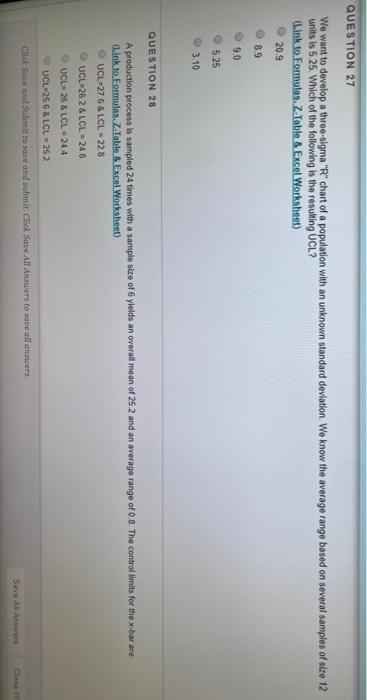
Question: QUESTION 27 We want to develop a three-sigma R chart of a population with an unknown standard deviation. We know the average range based on

QUESTION 27 We want to develop a three-sigma "R"
QUESTION 27 We want to develop a three-sigma "R" chart of a population with an unknown standard deviation. We know the average range based on several samples of size 12 units is 5 25 Which of the following is the resulting UCL? (Link to Formulas.Z.Table & Excel Worksheet) 20.9 89 9.0 525 3.10 QUESTION 28 A production process in sampled 24 times with a sample size of 6 yields an overall mean of 25 2 and an average range of 0.8. The control limits for the x-bar are (Link to Formulas.Z Table & Excel Worksheet) UCL-27.6 & LCL 228 UCL-26 2 & LCL = 24 8 UCL 25 & LCL-244 UCL.256 & LCL 252 Click Save and submit to save and submit. Click Save Alt Answers to save all answers, Save Al Answers

Step by Step Solution

There are 3 Steps involved in it

1 Expert Approved Answer
Step: 1 Unlock blur-text-image
Question Has Been Solved by an Expert!

Get step-by-step solutions from verified subject matter experts

Step: 2 Unlock
Step: 3 Unlock

Students Have Also Explored These Related General Management Questions!