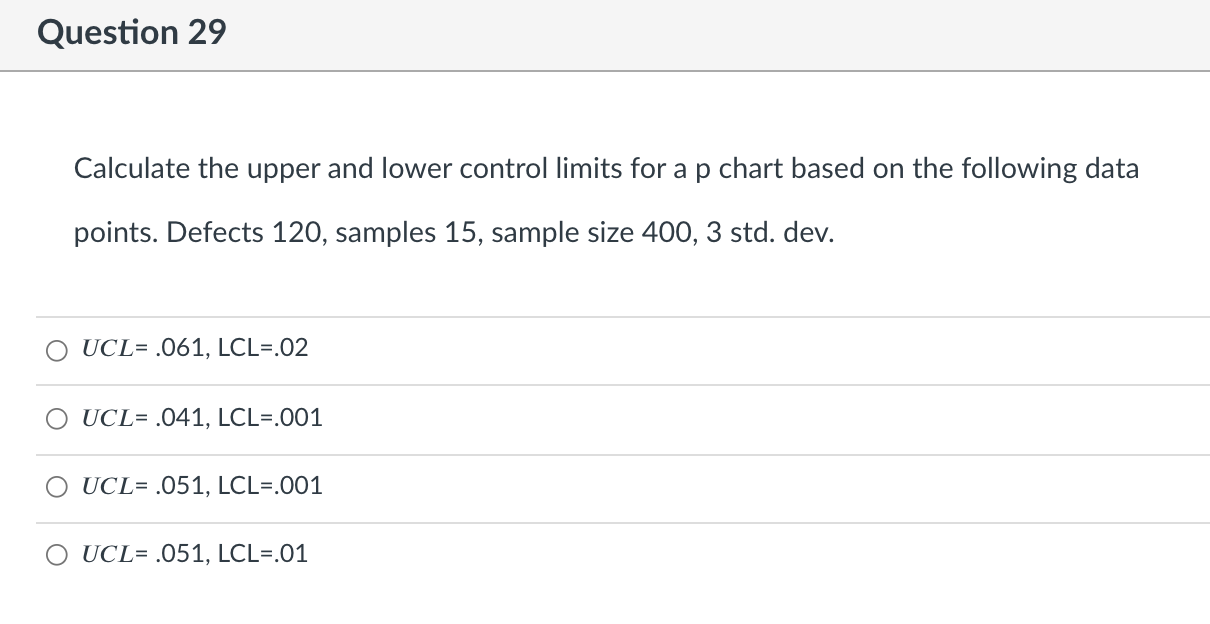
Question: Question 29 Calculate the upper and lower control limits for a p chart based on the following data points. Defects 120, samples 15, sample size

Question 29 Calculate the upper and lower controlQuestion 29 Calculate the upper and lower controlQuestion 29 Calculate the upper and lower controlQuestion 29 Calculate the upper and lower control

Question 29 Calculate the upper and lower control limits for a p chart based on the following data points. Defects 120, samples 15, sample size 400, 3 std. dev. O UCL= .061, LCL=.02 UCL= .041, LCL=.001 O UCL= .051, LCL=.001 UCL= .051, LCL=.01 Question 31 X - and R- (range) chart are used to determine goo-go situations - True False Question 33 Forecasting is a vital function and affects every significant management decision in these areas except. Human Resources Finance and accounting Production Marketing Question 34 All of statements are true about Decoupling Point except Forecasting helps determine the level of inventory needed at the decoupling points Inventory is stored, which allows SC to operate dependently Decision affected by the error produced in the forecast and the type of product Choice of the decoupling point in a supply chain is strategic

Step by Step Solution

There are 3 Steps involved in it

1 Expert Approved Answer
Step: 1 Unlock blur-text-image
Question Has Been Solved by an Expert!

Get step-by-step solutions from verified subject matter experts

Step: 2 Unlock
Step: 3 Unlock

Students Have Also Explored These Related General Management Questions!