

Question 2 The following diagram shows two economies, A and B . Each are in short-run equilibrium
Fantastic news! We've Found the answer you've been seeking!
Question:
Question 2
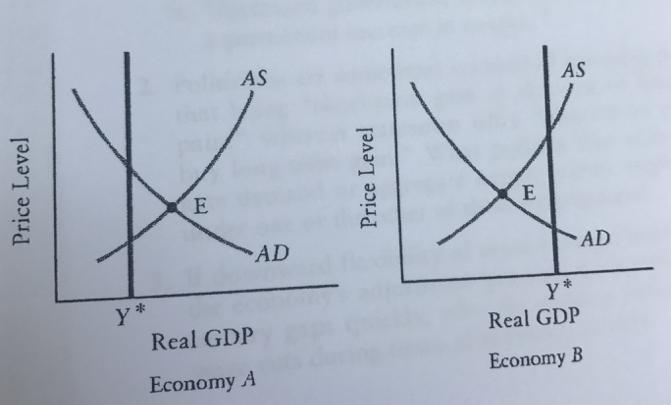
The following diagram shows two economies, A and B. Each are in short-run equilibrium at point E, where the aggregate demand (AD) and aggregate supply (AS) curves intersects.
2.1 Explain why in Economy A wages and other factor prices will begin to rise, and why this will increase firm’s unit costs.
2.2 Given your answer in [2.1], show the effect on the AS curve. Explain what happens to real GDP and the price level.
2.3 Explain why in Economy B wages and other factor prices will begin to fall, and why this will decrease firm’s unit costs.
2.4 Given your answer in [2.3], show the effect on the AS curve. Explain what happens to real GDP and the price level.
Expert Answer:
21 In economy A at the shortrun equilibrium the output is above the full employment level T... View the full answer

Related Book For 

Fundamentals of Investments Valuation and Management
ISBN: 978-0077283292
5th edition
Authors: Bradford D. Jordan, Thomas W. Miller
Posted Date:
