

Question: Question 3 ( 1 point ) Time - sequenced charts showing plotted values of a statistic, including a centerline average and one or more control
Question point
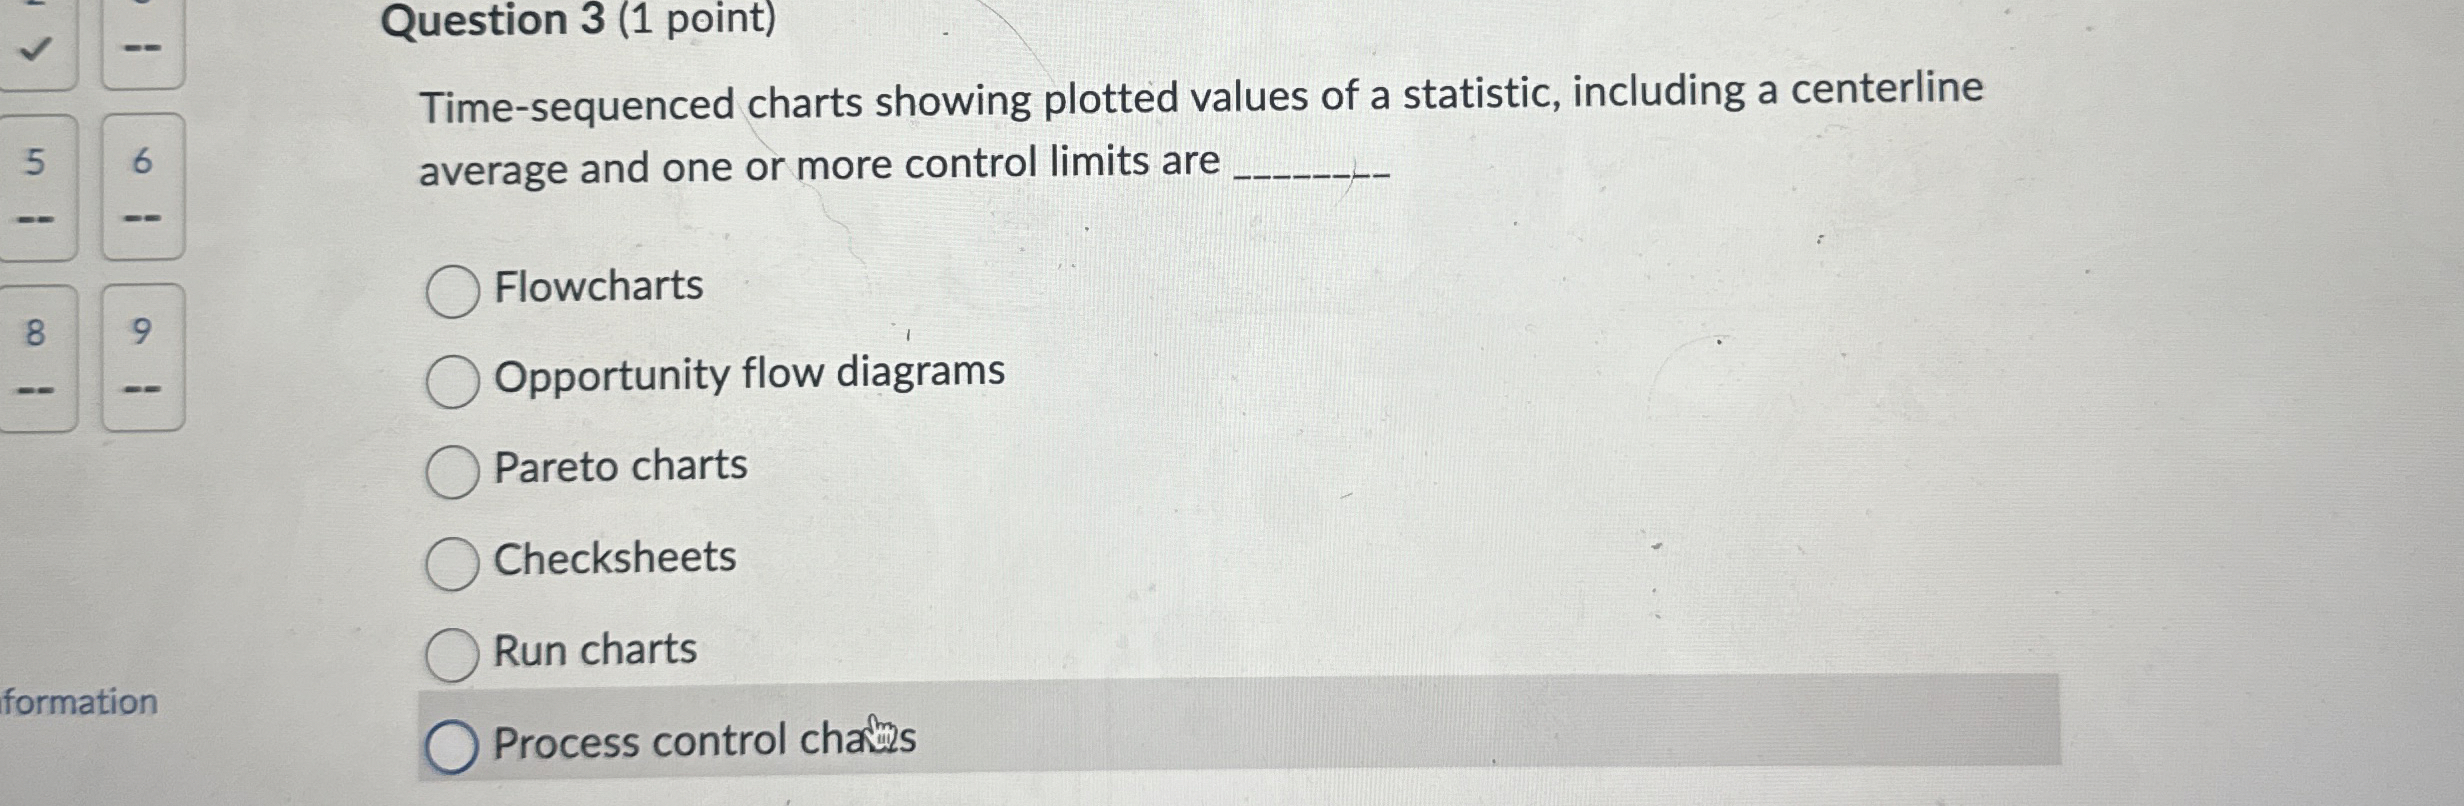
Timesequenced charts showing plotted values of a statistic, including a centerline average and one or more control limits are
Flowcharts
Opportunity flow diagrams
Pareto charts
Checksheets
Run charts
formation
Process control chams
Step by Step Solution
There are 3 Steps involved in it
1 Expert Approved Answer
Step: 1 Unlock

Question Has Been Solved by an Expert!
Get step-by-step solutions from verified subject matter experts
Step: 2 Unlock
Step: 3 Unlock