

Question: Question 3 1 pts Consider the following stem and leaf plot that shows the LDL cholesterol levels (in milligram per deciliter [mgfd L]) for nonsmokers.

![that shows the LDL cholesterol levels (in milligram per deciliter [mgfd L])](https://s3.amazonaws.com/si.experts.images/answers/2024/06/66741136c924a_61466741136a2865.jpg)


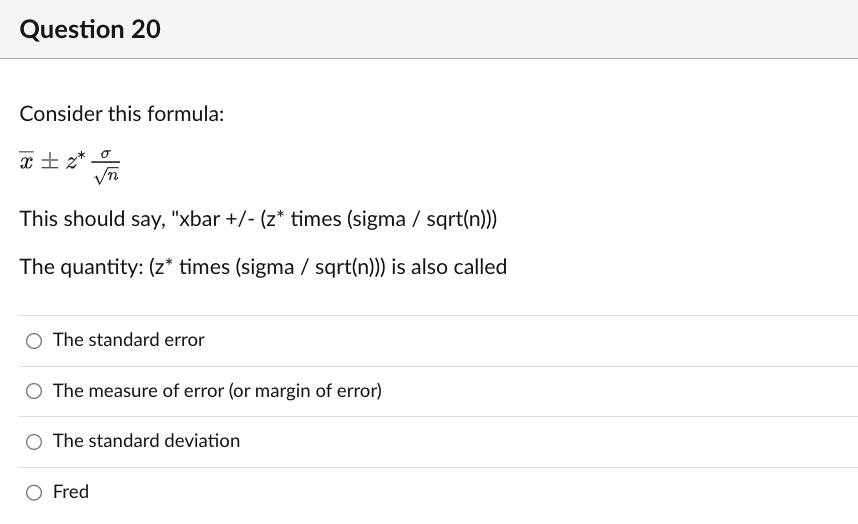
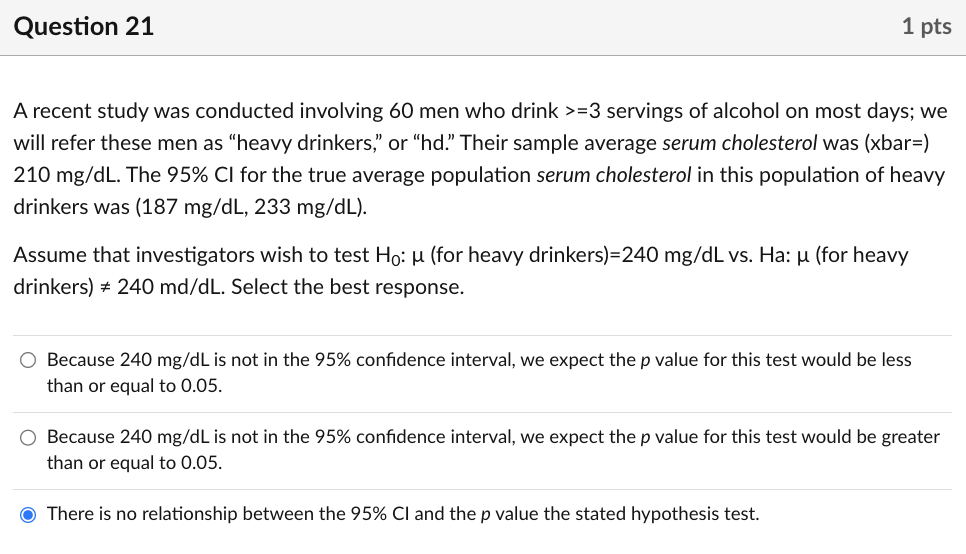
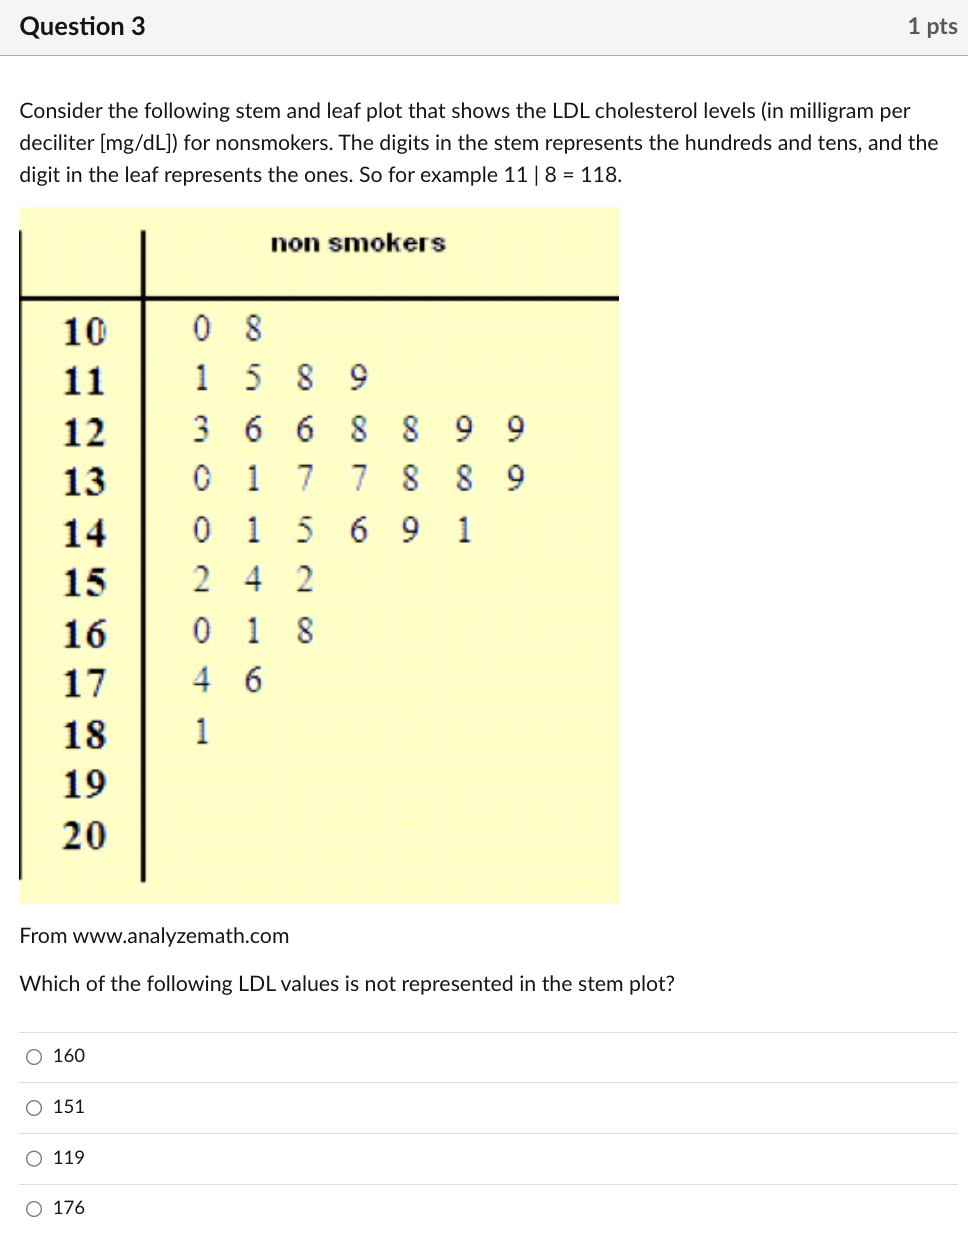
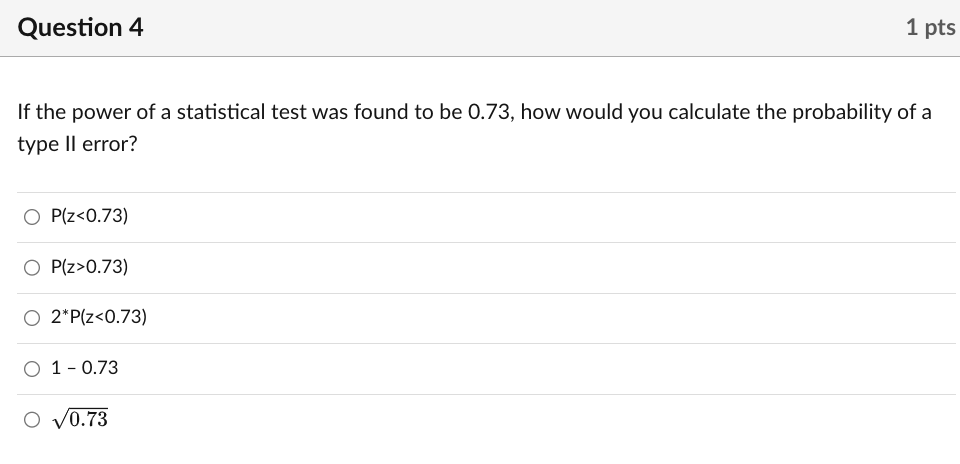


Question 3 1 pts Consider the following stem and leaf plot that shows the LDL cholesterol levels (in milligram per deciliter [mgfd L]) for nonsmokers. The digits in the stem represents the hundreds and tens, and the digit in the leaf represents the ones. So for example 11 | 8 = 118. non smokers 11103 111539 12 3668899 13 017\"339 1-4 015691 15 24.1 15 013 17 46 1 18 19 20 From wwwanalyzemathcom Which of the following LDL values is not represented in the stem plot? O 160 O 151 O 119 O 176 Question 4 1 pts If the power of a statistical test was found to be 0.73, how would you calculate the probability of a type ll error? O P(z0.73) O 2*P(Z=3 servings of alcohol on most days; we will refer these men as "heavy drinkers," or "hd." Their sample average serum cholesterol was (xbar=) 210 mg/dL. The 95% CI for the true average population serum cholesterol in this population of heavy drinkers was {187 mgde, 233 mgde}. Assume that investigators wish to test H0: u {for heavy drinkers)=240 mngL vs. Ha: u {for heavy drinkers) == 240 md/dL. Select the best response. 0 Because 240 mngL is not in the 95% condence interval. we expect the p value for this test would be less than or equal to 0.05. 0 Because 240 mngL is not in the 95% condence interval, we expect the p value for this test would be greater than or equal to 0.05. (3) There is no relationship between the 95% Cl and the p value the stated hypothesis test
Step by Step Solution
There are 3 Steps involved in it

Get step-by-step solutions from verified subject matter experts