

Question: Question 3 1 pts The histogram below shows the amount of time spent on a new app on mobile phones by thousand teenagers over the
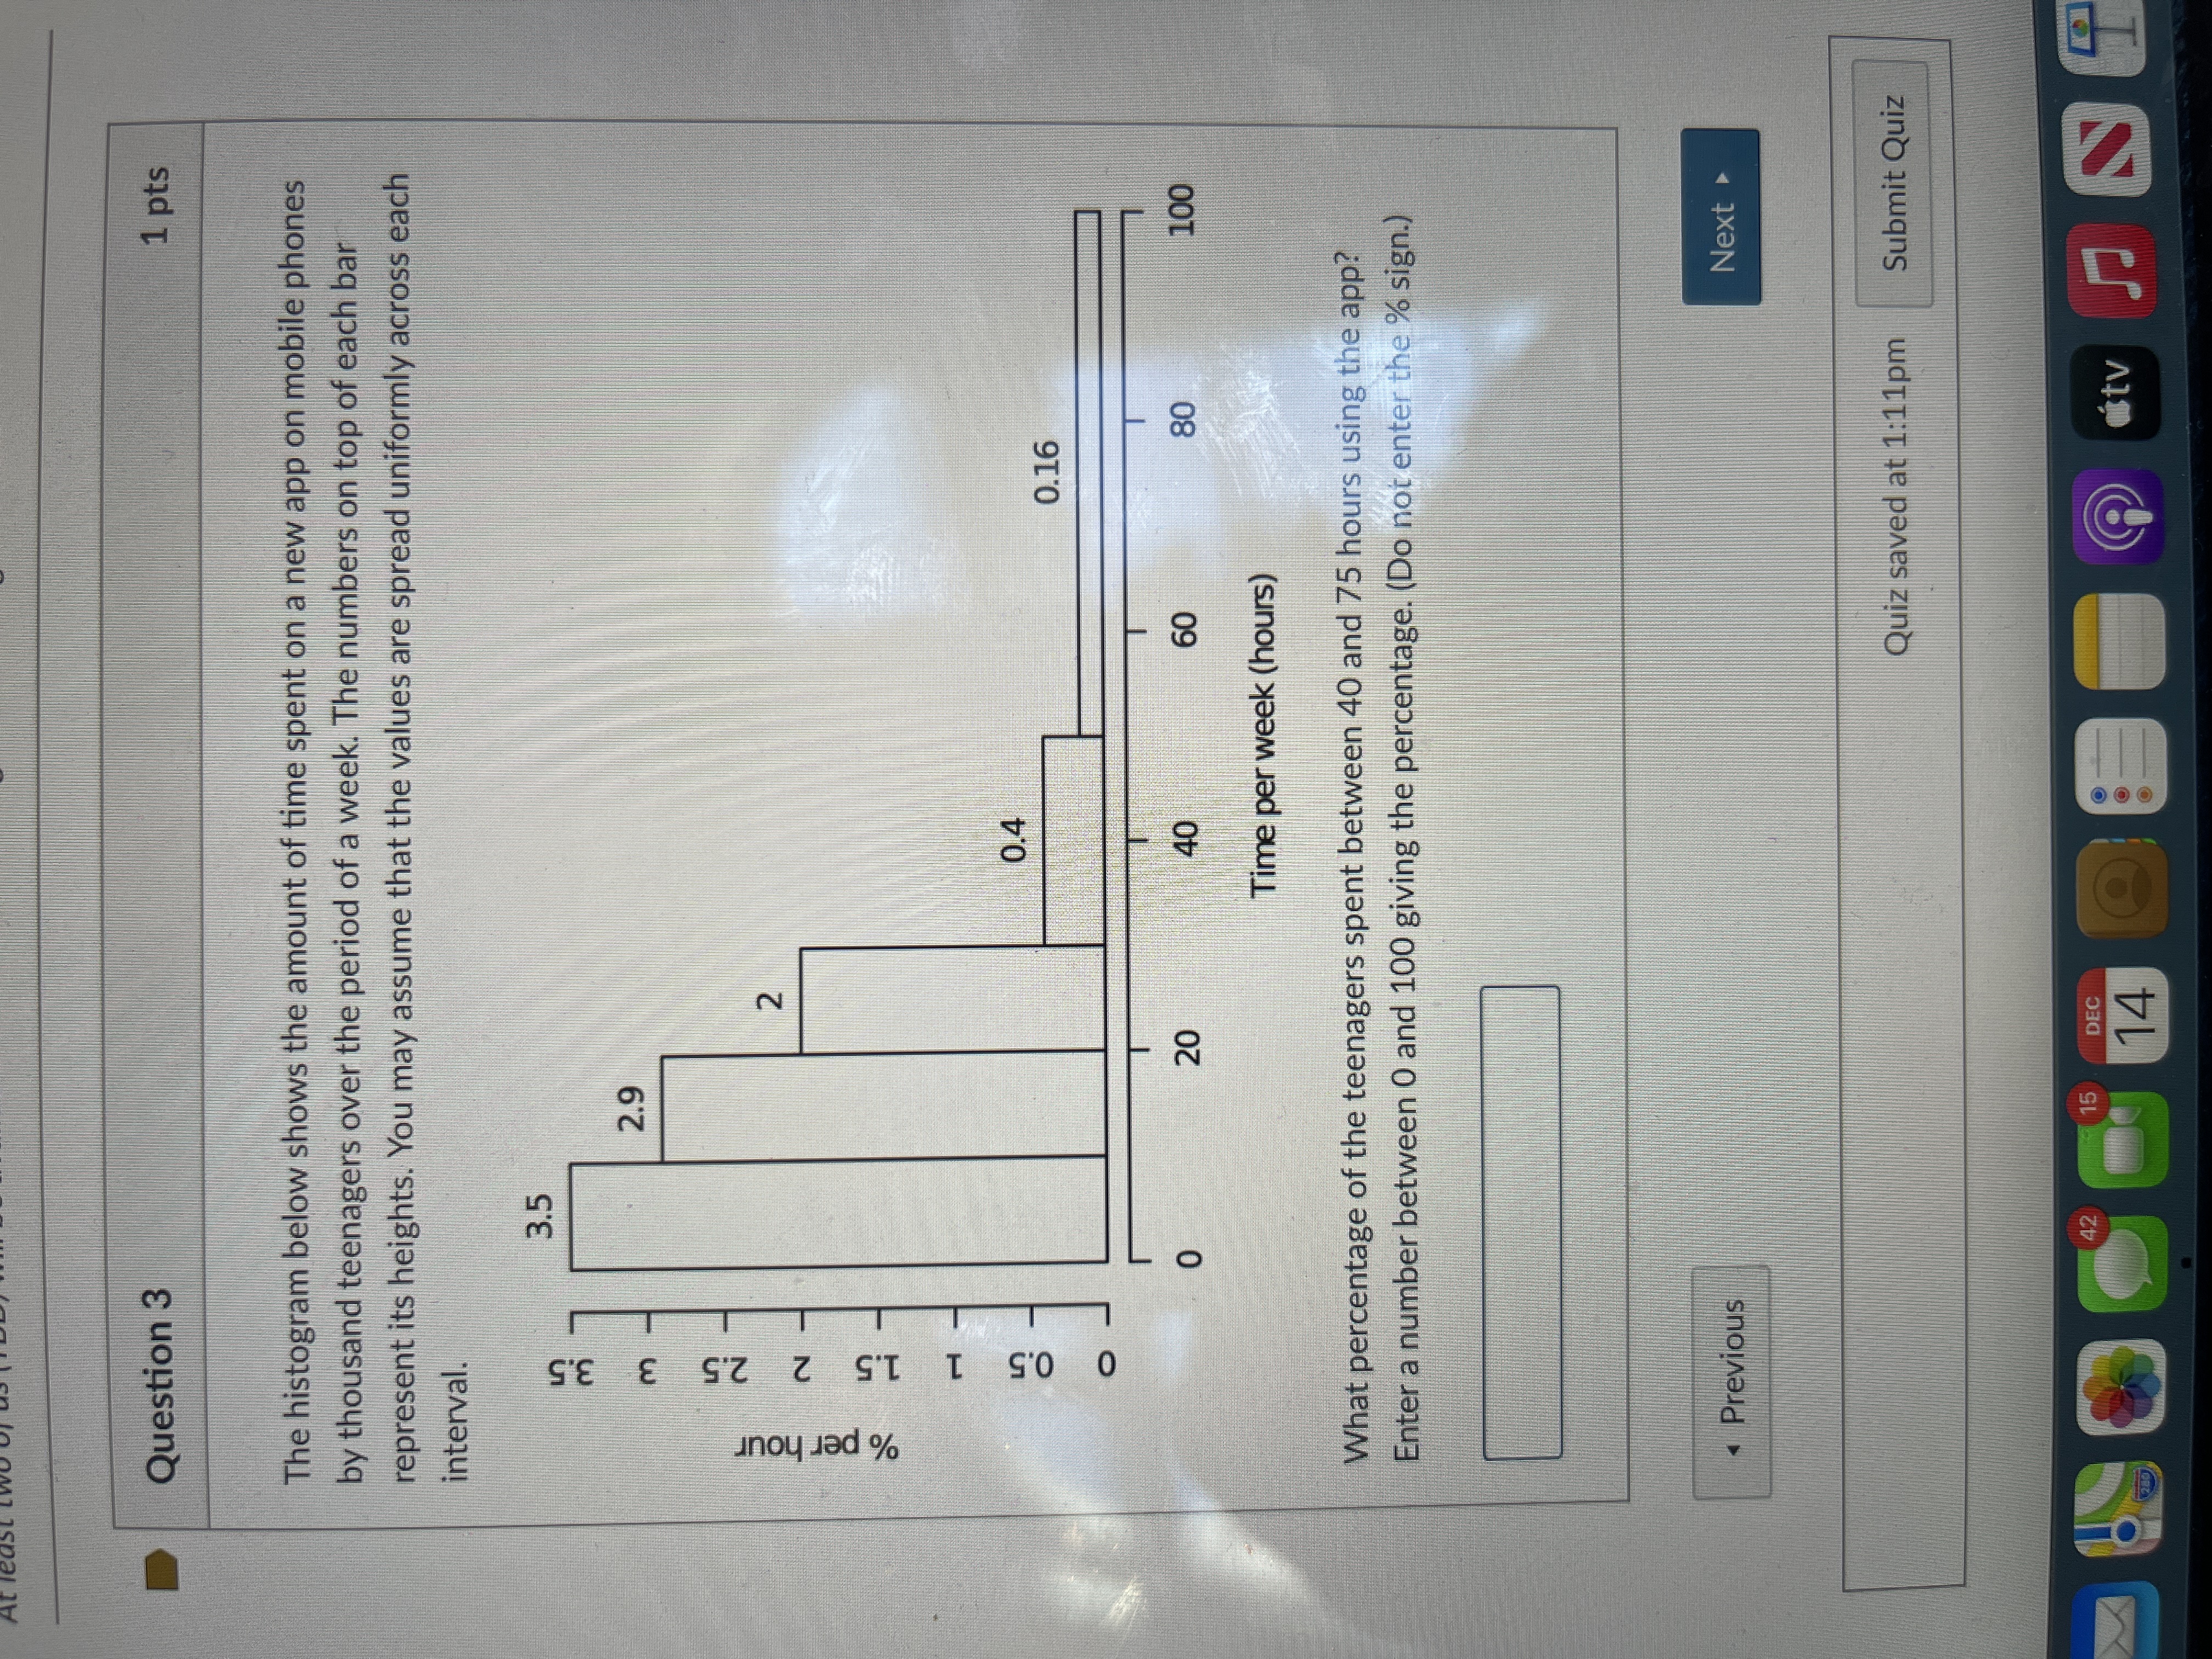

Question 3 1 pts The histogram below shows the amount of time spent on a new app on mobile phones by thousand teenagers over the period of a week. The numbers on top of each bar represent its heights. You may assume that the values are spread uniformly across each interval. 3.5 2.9 2 % per hour 0 0.5 1 1.5 2 2.5 3 3.5 0.4 0.16 0 20 40 60 80 100 Time per week (hours) What percentage of the teenagers spent between 40 and 75 hours using the app? Enter a number between 0 and 100 giving the percentage. (Do not enter the % sign.) . Previous Next Quiz saved at 1:11pm Submit Quiz 15 DEC 14 utv
Step by Step Solution
There are 3 Steps involved in it
1 Expert Approved Answer
Step: 1 Unlock

Question Has Been Solved by an Expert!
Get step-by-step solutions from verified subject matter experts
Step: 2 Unlock
Step: 3 Unlock