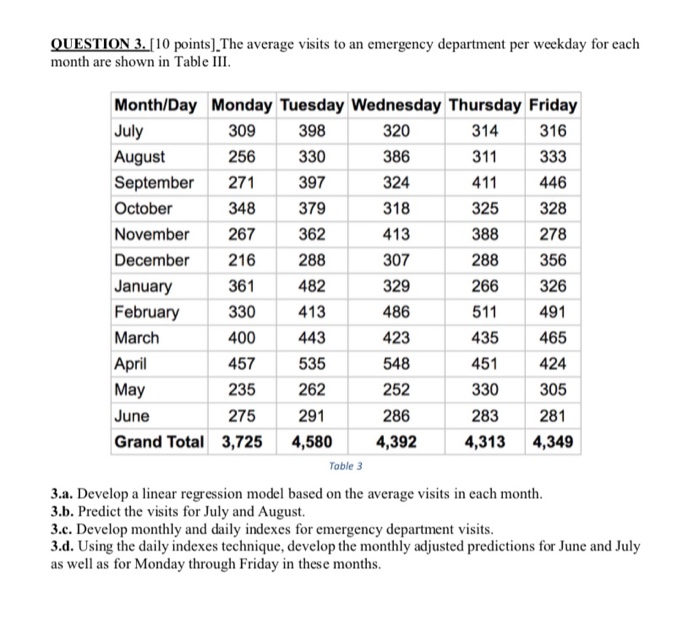
Question: QUESTION 3. [10 points). The average visits to an emergency department per weekday for each month are shown in Table III. 386 411 446 326

QUESTION 3. [10 points). The average visits to an
QUESTION 3. [10 points). The average visits to an emergency department per weekday for each month are shown in Table III. 386 411 446 326 Month/Day Monday Tuesday Wednesday Thursday Friday July 309 398 320 314 316 August 256 330 311 333 September 271 397 324 October 348 379 318 325 328 November 267 362 413 388 278 December 216 288 307 288 356 January 361 482 329 266 February 330 413 486 511 491 March 400 443 423 435 465 April 457 535 548 451 424 May 235 262 252 330 305 June 275 291 286 283 281 Grand Total 3,725 4,580 4,392 4,313 4,349 Table 3 3.a. Develop a linear regression model based on the average visits in each month. 3.b. Predict the visits for July and August 3.c. Develop monthly and daily indexes for emergency department visits. 3.d. Using the daily indexes technique, develop the monthly adjusted predictions for June and July as well as for Monday through Friday in these months

Step by Step Solution

There are 3 Steps involved in it

1 Expert Approved Answer
Step: 1 Unlock blur-text-image
Question Has Been Solved by an Expert!

Get step-by-step solutions from verified subject matter experts

Step: 2 Unlock
Step: 3 Unlock

Students Have Also Explored These Related General Management Questions!